New data published by San Diego County on Thursday shows coronavirus case rates in individual cities and ZIP codes, painting a more detailed picture of which communities are being hit the hardest.
The interactive dashboard color codes neighborhoods and municipalities in accordance with the state's four-tier reopening blueprint.
San Diego County was pushed into the most restrictive tier, the Purple Tier, on Tuesday, so it's not much of a surprise to see the majority of our county map shaded in that color.
Click here to see the county's dashboard.
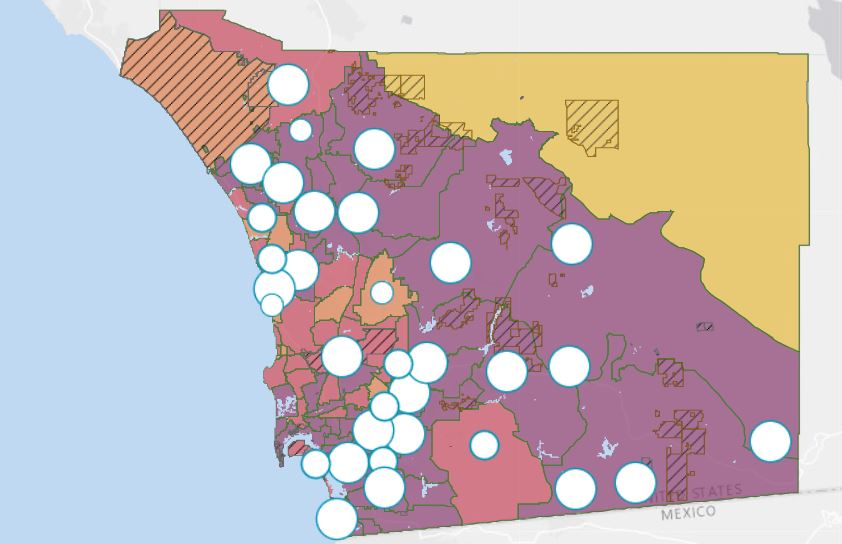
A snapshot of a map showing case rates by municipality in San Diego County.
What's of greater concern is the alarmingly-high case rates in individual communities.
On the bottom left of the dashboard, users can toggle between case rates by ZIP code and case rates by jurisdiction. The rates are calculated using the number of new cases in the region within a seven-day period, with a seven-day lag.
The data published Thursday reflects cases reported between Oct. 25 and Oct. 31.
The 92173 ZIP code, which covers San Ysidro, has a listed case rate of 27.4, more than four times the case rate limit that qualifies counties for Purple Tier.
The surrounding 92154 ZIP code, which stretches from the border of Imperial Beach east past Otay Mesa, has a case rate of 21.6, according to the county's data.
Nearly all of rural East County and most communities south of Interstate 8 show case rates well above the Purple Tier threshold of 7.
The city of El Cajon, which is home to more than 105,000 people, had a case rate of 24.1. Elsewhere, Lakeside checked in with a case rate of 16.6, Ramona is at 16.2, and Spring Valley showed a case rate of 28.9, according to the dashboard.
Many communities north of State Route 52 were shaded red with case rates in the 4 to 7 range, including Santee.
NBC 7's Dave Summers took a look at how a new wave of restrictions might change lively communities like Pacific Beach
The dashboard stipulates that "jurisdictions with less than 20 cases in the seven-day period can result in unstable rate estimates and should be interpreted with caution."
Del Mar and Poway were shaded orange with individual case rates between 1 and 3.9, as were coastal ZIP codes like 92093, 92161, 92009 and 92011. Neither of those regions showed more than 20 new cases.
County health officials said the dashboard will be updated every Thursday.
NBC 7 also looked at county data showing settings most linked to recent coronavirus cases.
According to the data, the settings most linked to recent coronavirus cases are work or business settings, which account for 34.3% of the county’s positive COVID-19 cases from Oct. 25 through Nov. 7.
"case" - Google News
November 13, 2020 at 01:45PM
https://ift.tt/36vjlBB
MAP: County Publishes Data Showing Case Rates by City, ZIP Code - NBC San Diego
"case" - Google News
https://ift.tt/37dicO5
Shoes Man Tutorial
Pos News Update
Meme Update
Korean Entertainment News
Japan News Update
Bagikan Berita Ini


0 Response to "MAP: County Publishes Data Showing Case Rates by City, ZIP Code - NBC San Diego"
Post a Comment