Silent computing systems are preferable for a multitude of use-cases ranging from industrial applications (where dust and fans make for a troublesome configuration) to noiseless HTPCs (particularly for audiophiles). Akasa has been providing thermal solutions in multiple computing verticals for more than 20 years, with a particular focus on passive cooling. Akasa targeted the NUC form-factor early, with the introduction of the Newton chassis for Ivy Bridge NUCs in early 2013. Last year, the company unveiled the Turing fanless case for the Bean Canyon NUCs. It marked a complete re-design of their NUC solution. This review takes a look at the build process and performance characteristics of a NUC8i5BEK board in the Turing chassis.
Use-cases for many silent or decade long deployment computing systems require the complete absence of any moving parts. In industrial deployments, the reason may be the need to avoid performance loss due to cooling efficiency degradation resulting from dust build-up. For professional creators, it may be due to the need to avoid extraneous noise affecting the work output. The average home consumer may also prefer a silent system to better focus on the work at hand. For HTPCs, multimedia content can be enjoyed without distractions - an aspect that may be of paramount importance to audiophiles.
Traditionally, passively cooled computing systems have either been woefully underpowered for general purpose use, or carried a significant premium in terms of both cost and physical footprint. Recent advancements in compute performance per watt and novel passive cooling chassis designs (that do not cost an arm and a leg to mass-produce) have combined to give consumers the ability to create powerful, yet affordable, fanless systems. Akasa has been offering passively-cooled cases for NUC boards since 2013.
Akasa Fanless NUC Cases - A Brief History
Akasa introduced their first NUC fanless chassis for the Ivy Bridge NUC, and quickly expanded their offerings to include standard desktop, low-profile, and waterproof models. Since then, each generation has seen variants of the same chassis with a few tweaks. Once ever few years, the company has thrown in some interesting re-designs. Broadly speaking, the fanless NUC cases from Akasa fall into one of these families:
- Newton
- Tesla
- Pascal (IP65)
- Plato (low profile)
- Turing
The Plato models are low-profile (38.5mm in height), while the Pascal models are IP65-rated (waterproof). The Turing has a contemporary design. Almost all of the recent models support 2.5" drive bays. The Akasa offerings for various NUCs are summarized in the table below.
| Akasa Fanless NUC Cases | ||
| Chassis Model | NUC Generation | Notes |
| Newton Newton V Tesla Pascal |
3rd Gen. (Ivy Bridge) NUCs | V model for the vPro Ivy Bridge NUC |
| Newton H Tesla H Newton X |
4th Gen. (Haswell) NUCs | Tesla H includes 2x 2.5" drive bays |
| Newton T Tesla T |
Bay Trail Atom (Embedded) NUC | Newton T is taller, while Tesla T is wider |
| Newton L | Bay Trail Celeron NUC | |
| Newton MC Newton S Plato MC Plato Plato X Max S Max MT Pascal MC |
5th Gen. (Broadwell) NUCs | Max S includes a rear serial port and an ODD bay Max MT includes a rear serial port and two 2.5" SATA trays Newton MC includes a front serial port Newton S includes a rear serial port Plato low-profile cases support i3 and i5 models, X supports i7 in addition Pascal MC supports only the i3 model |
| Newton P | Braswell NUCs | |
| Newton S6 Plato X6 Max MT6 |
5th Gen. (Broadwell) NUCs & 6th Gen (Skylake) NUCs | Replaceable front and rear panels to support both 5th and 6th Gen. non-i7 NUCs Characteristics similar to the non-6 variants |
| Newton S6T | 6th Gen (Skylake) NUCs | Support for non-i7 Skylake NUCs only Similar to Newton S6 except for the power switch and LED being on the top panel instead of the front |
| Galactico | Skull Canyon NUC | |
| Newton AC | Apollo Lake Celeron NUC | |
| Newton S7 Plato X7 Pascal MD |
7th Gen (Kaby Lake) NUCs | |
| Newton S7D Newton D3 Plato X7D Pascal MC3 |
7th Gen (Kaby Lake & Kaby Lake-R) NUCs | D3 includes a front serial port, while S7D has it in the rear panel |
| Newton JC | Gemini Lake NUCs | |
| Plato X8 Pascal BC Turing |
8th Gen (Coffee Lake) NUCs | Turing is a contemporary re-imagination of a fanless NUC chassis |
| Plato PX Newton PX |
8th Gen (Whiskey Lake) Pro NUCs | |
| Turing FX | 10th Gen (Comet Lake) NUCs | Contemporary Turing design with updated I/O panels |
The unit we are looking at today is the first Bean Canyon NUC Akasa Turing chassis. As mentioned in the Frost Canyon NUC review, the Bean Canyon NUC offers a better all-round package. With the introduction of the 10nm Ice Lake processors with a leap in graphics capabilities and the incoming mini-PCs based on that, the Bean Canyon models currently in the retail channel may offer excellent value for money (given that they are going to be discounted). As we shall see in the rest of the review, the Akasa Turing can act as the perfect case for users looking to silence the Bean Canyon NUC.
Setting the Stage
Akasa had provided us with a review sample of the Turing from the first batch last year, and Intel sent us the NUC8i5BEK (Core i5-based Bean Canyon NUC) for use with the Turing. This provided us with the opportunity to look at the performance characteristics of the actively cooled version and compare it against the Turing-based passively cooled one for the same BIOS settings and internal hardware configuration.
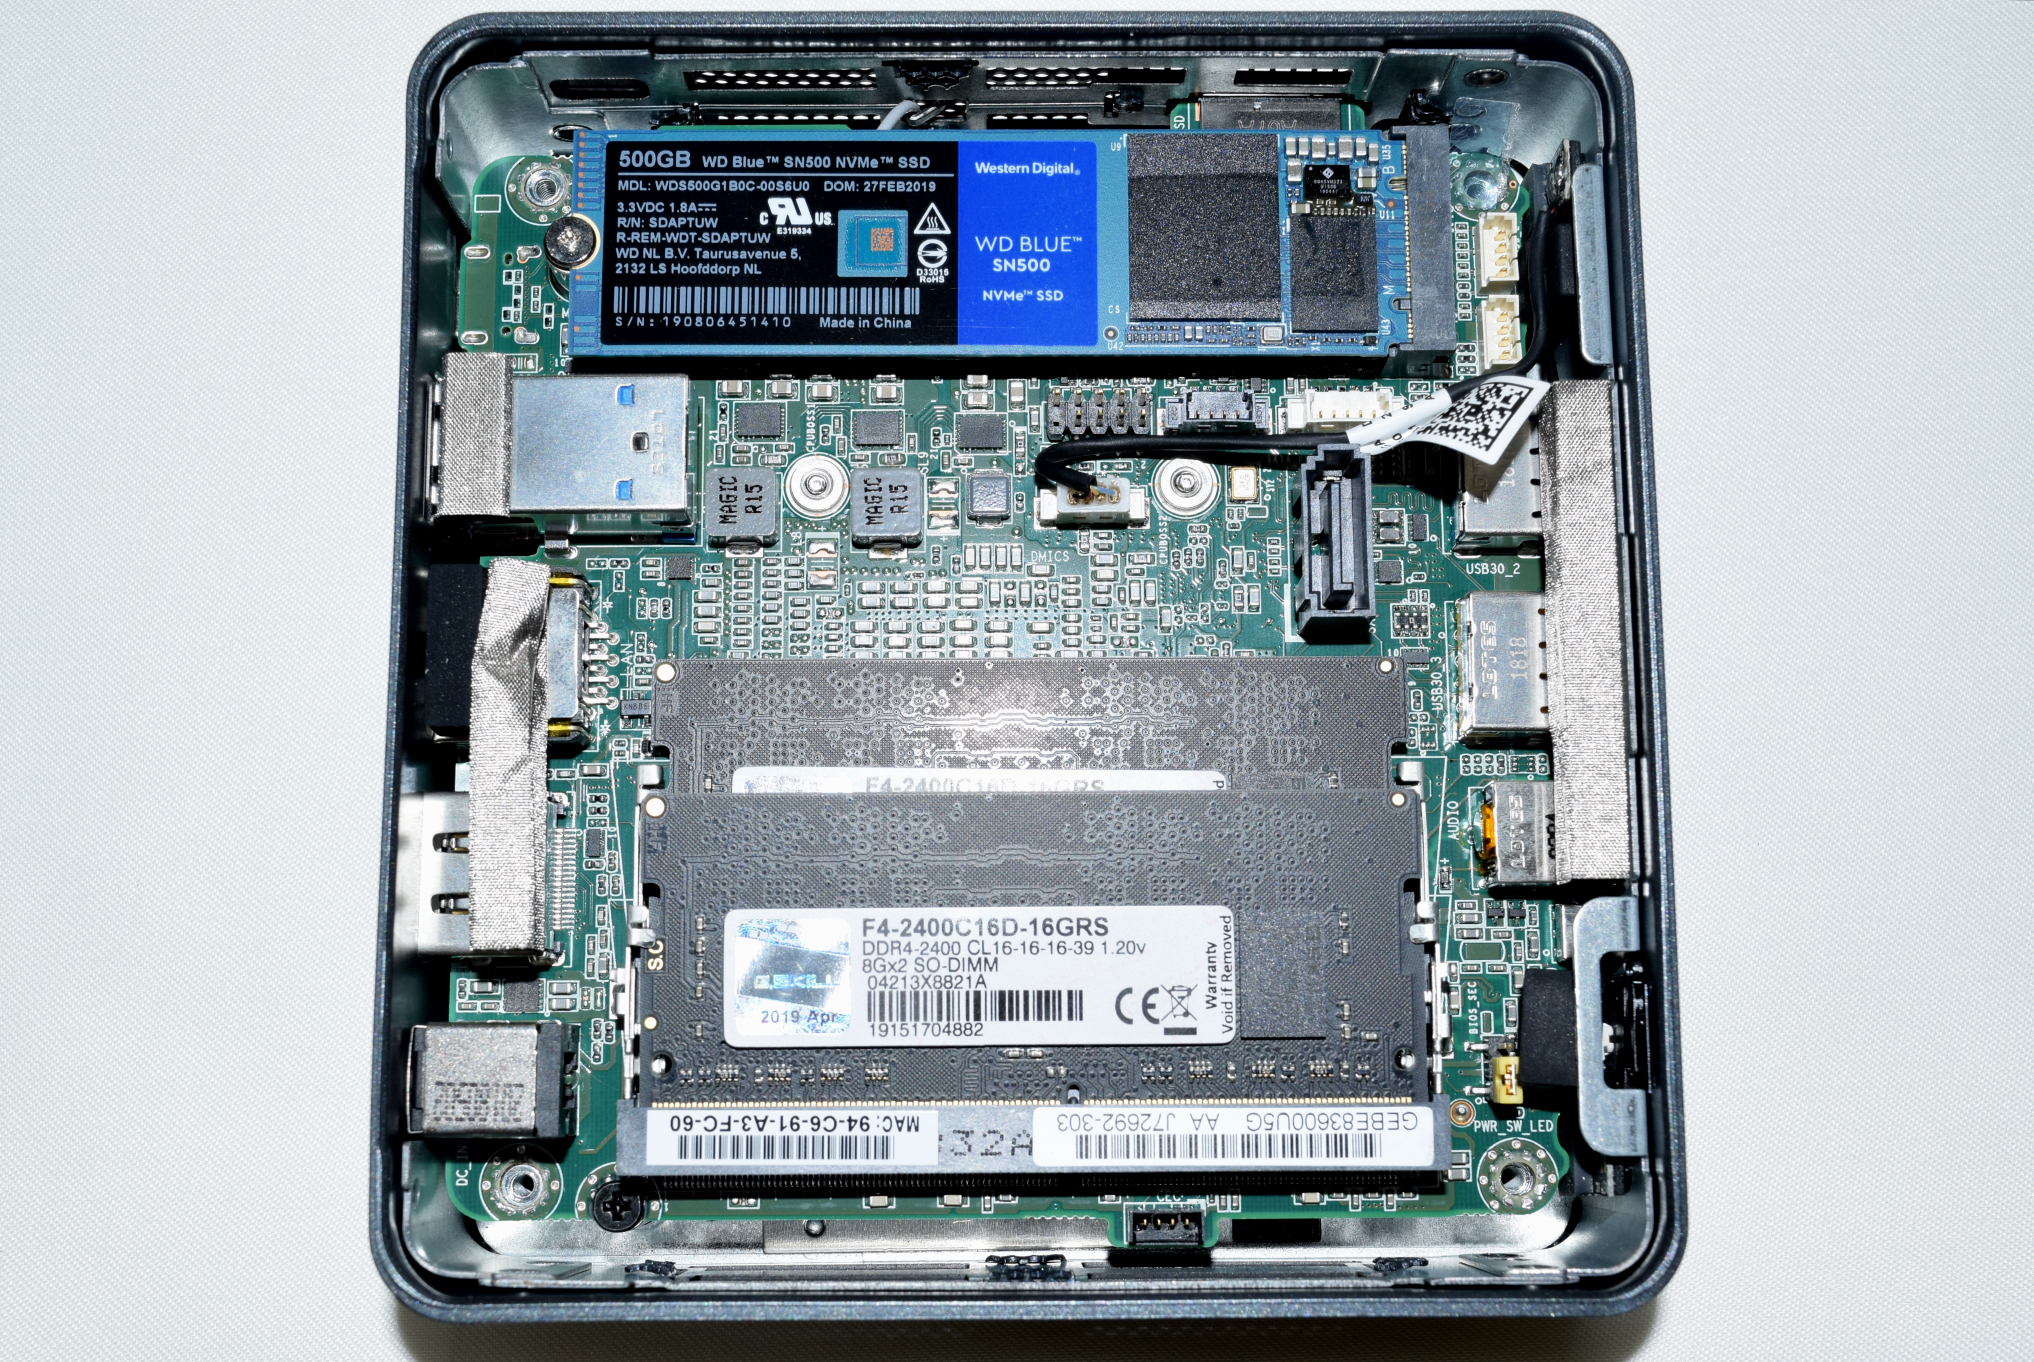
A judicious choice of build components tuned for low-power and energy-efficient operation is advisable for passively-cooled builds. Towards that, we chose DDR4 SODIMMs that had a maximum operating frequency corresponding to the qualified memory type for the NUC8i5BEK. On the storage side, we chose a DRAM-less entry-level NVMe SSD with good power efficiency.
- G.Skill Ripjaws DDR4-SODIMM (F4-2400C16S-8GRS)
- Western Digital SN500 PCIe 3.0 x2 NVMe SSD
Note that these components are from the time of the build last year - Since then, WD has introduced the SN550 PCIe 3.0 x4 NVMe SSD as an update for the same entry-level segment.
This review will not go into the hardware features of the Bean Canyon NUC. For that, readers may refer to the review of the NUC8i7BEH - the version with a Core i7 processor. The Core i5 version being looked at today carries over all the features that matter - a 28W TDP processor with four cores and eight threads, Iris Plus Graphics with integrated eDRAM, USB 3.2 Gen 2 (10Gbps) support on all external Type-A ports, a single Thunderbolt 3 port, and 4Kp60 support with HDCP 2.2 on the HDMI port. This configuration will serve users well even with the Tiger Lake NUCs on the horizon, particularly for non-HTPC applications. Unless 8K playback and AV1 hardware acceleration are needed, the Bean Canyon NUCs can do an excellent job even for HTPCs.
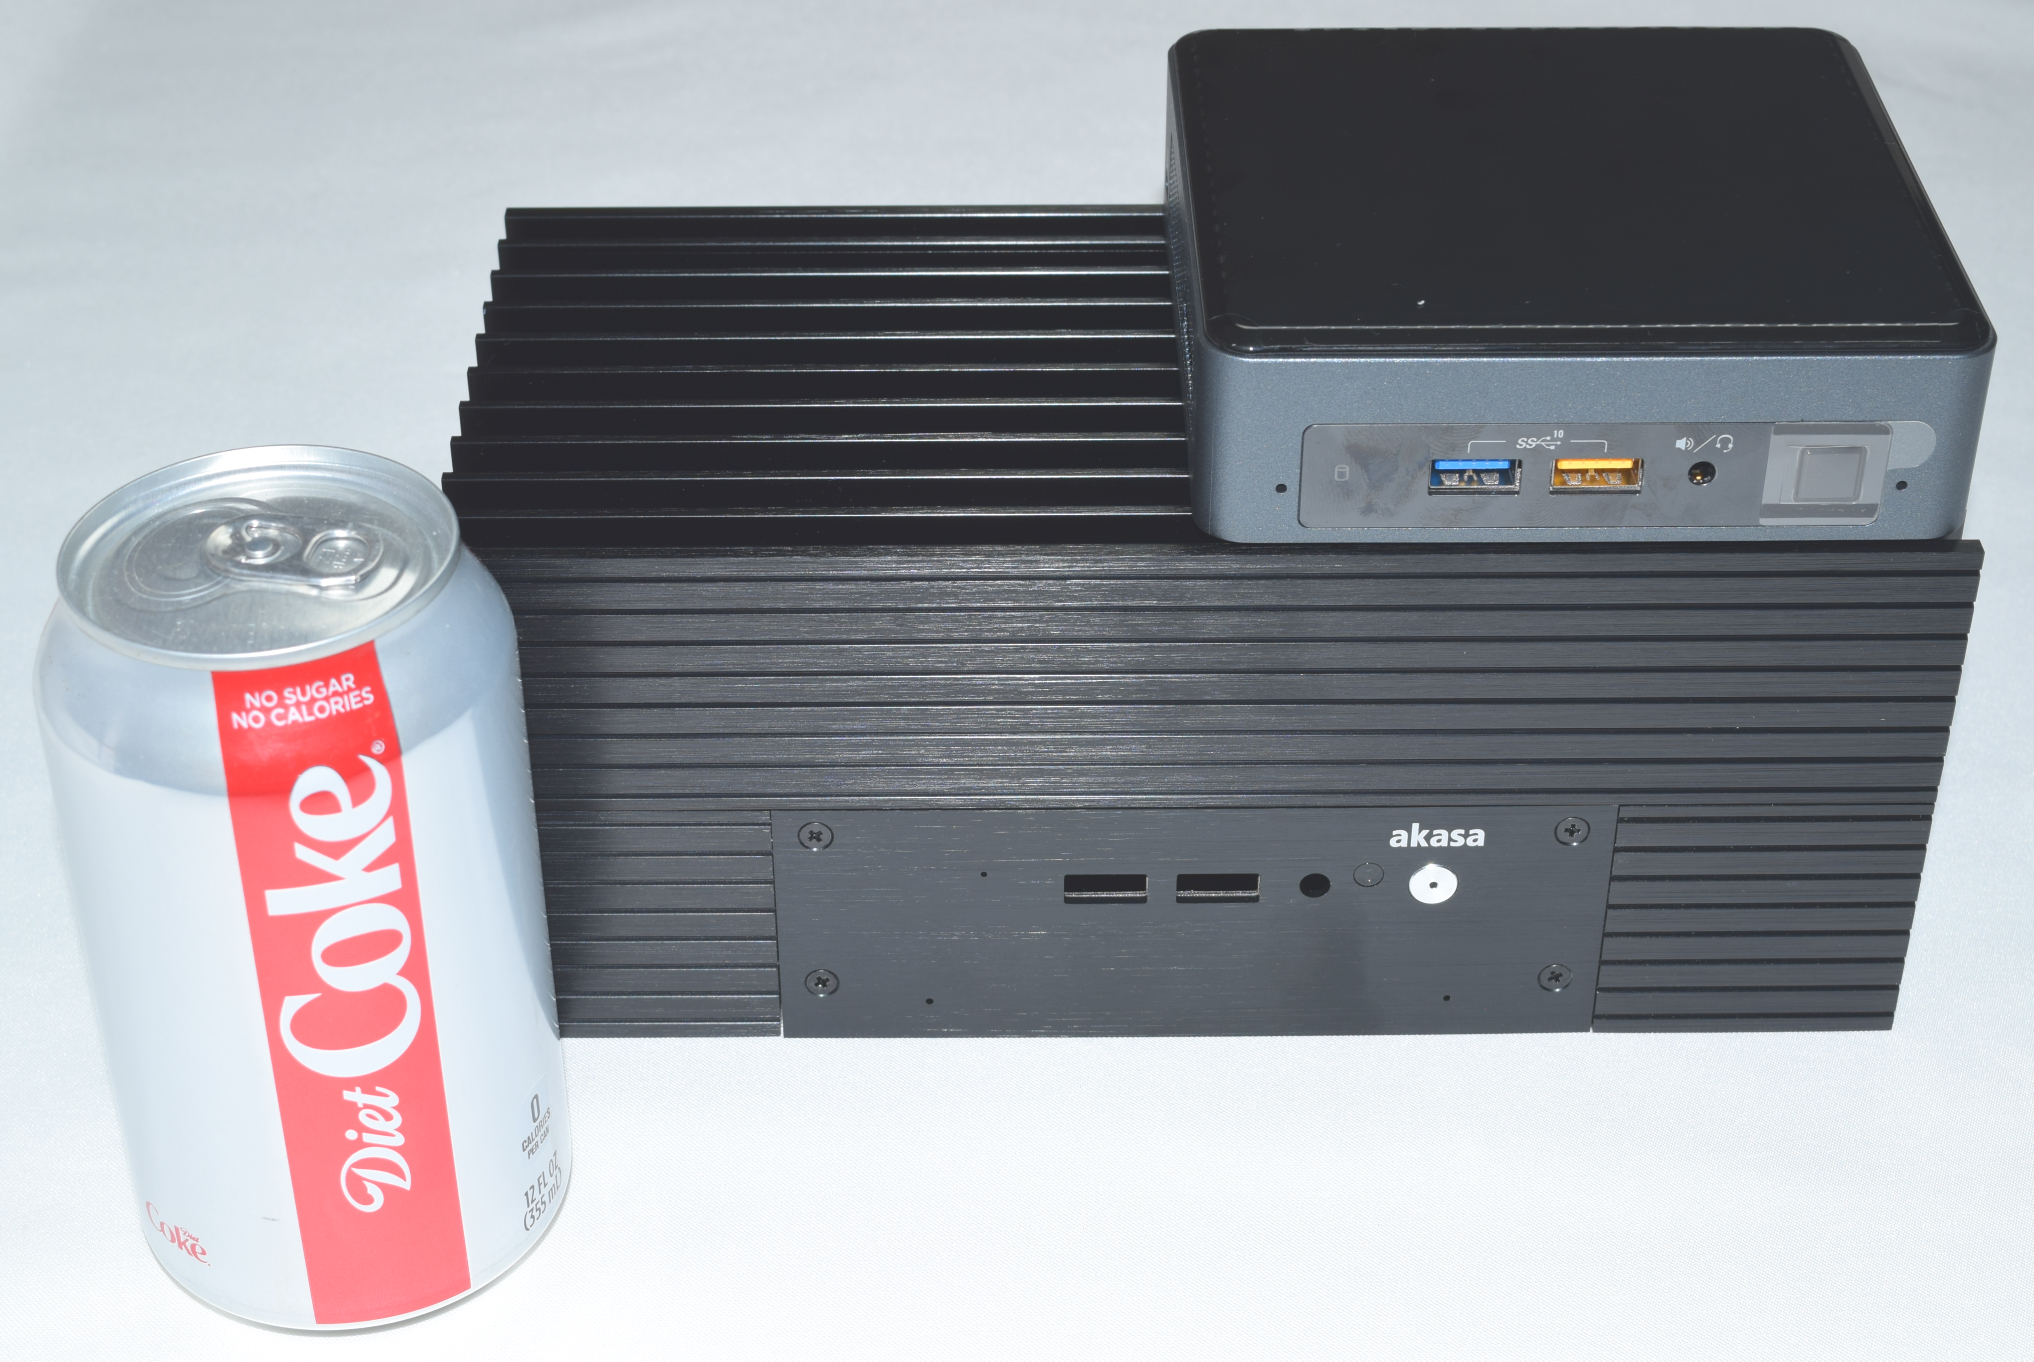
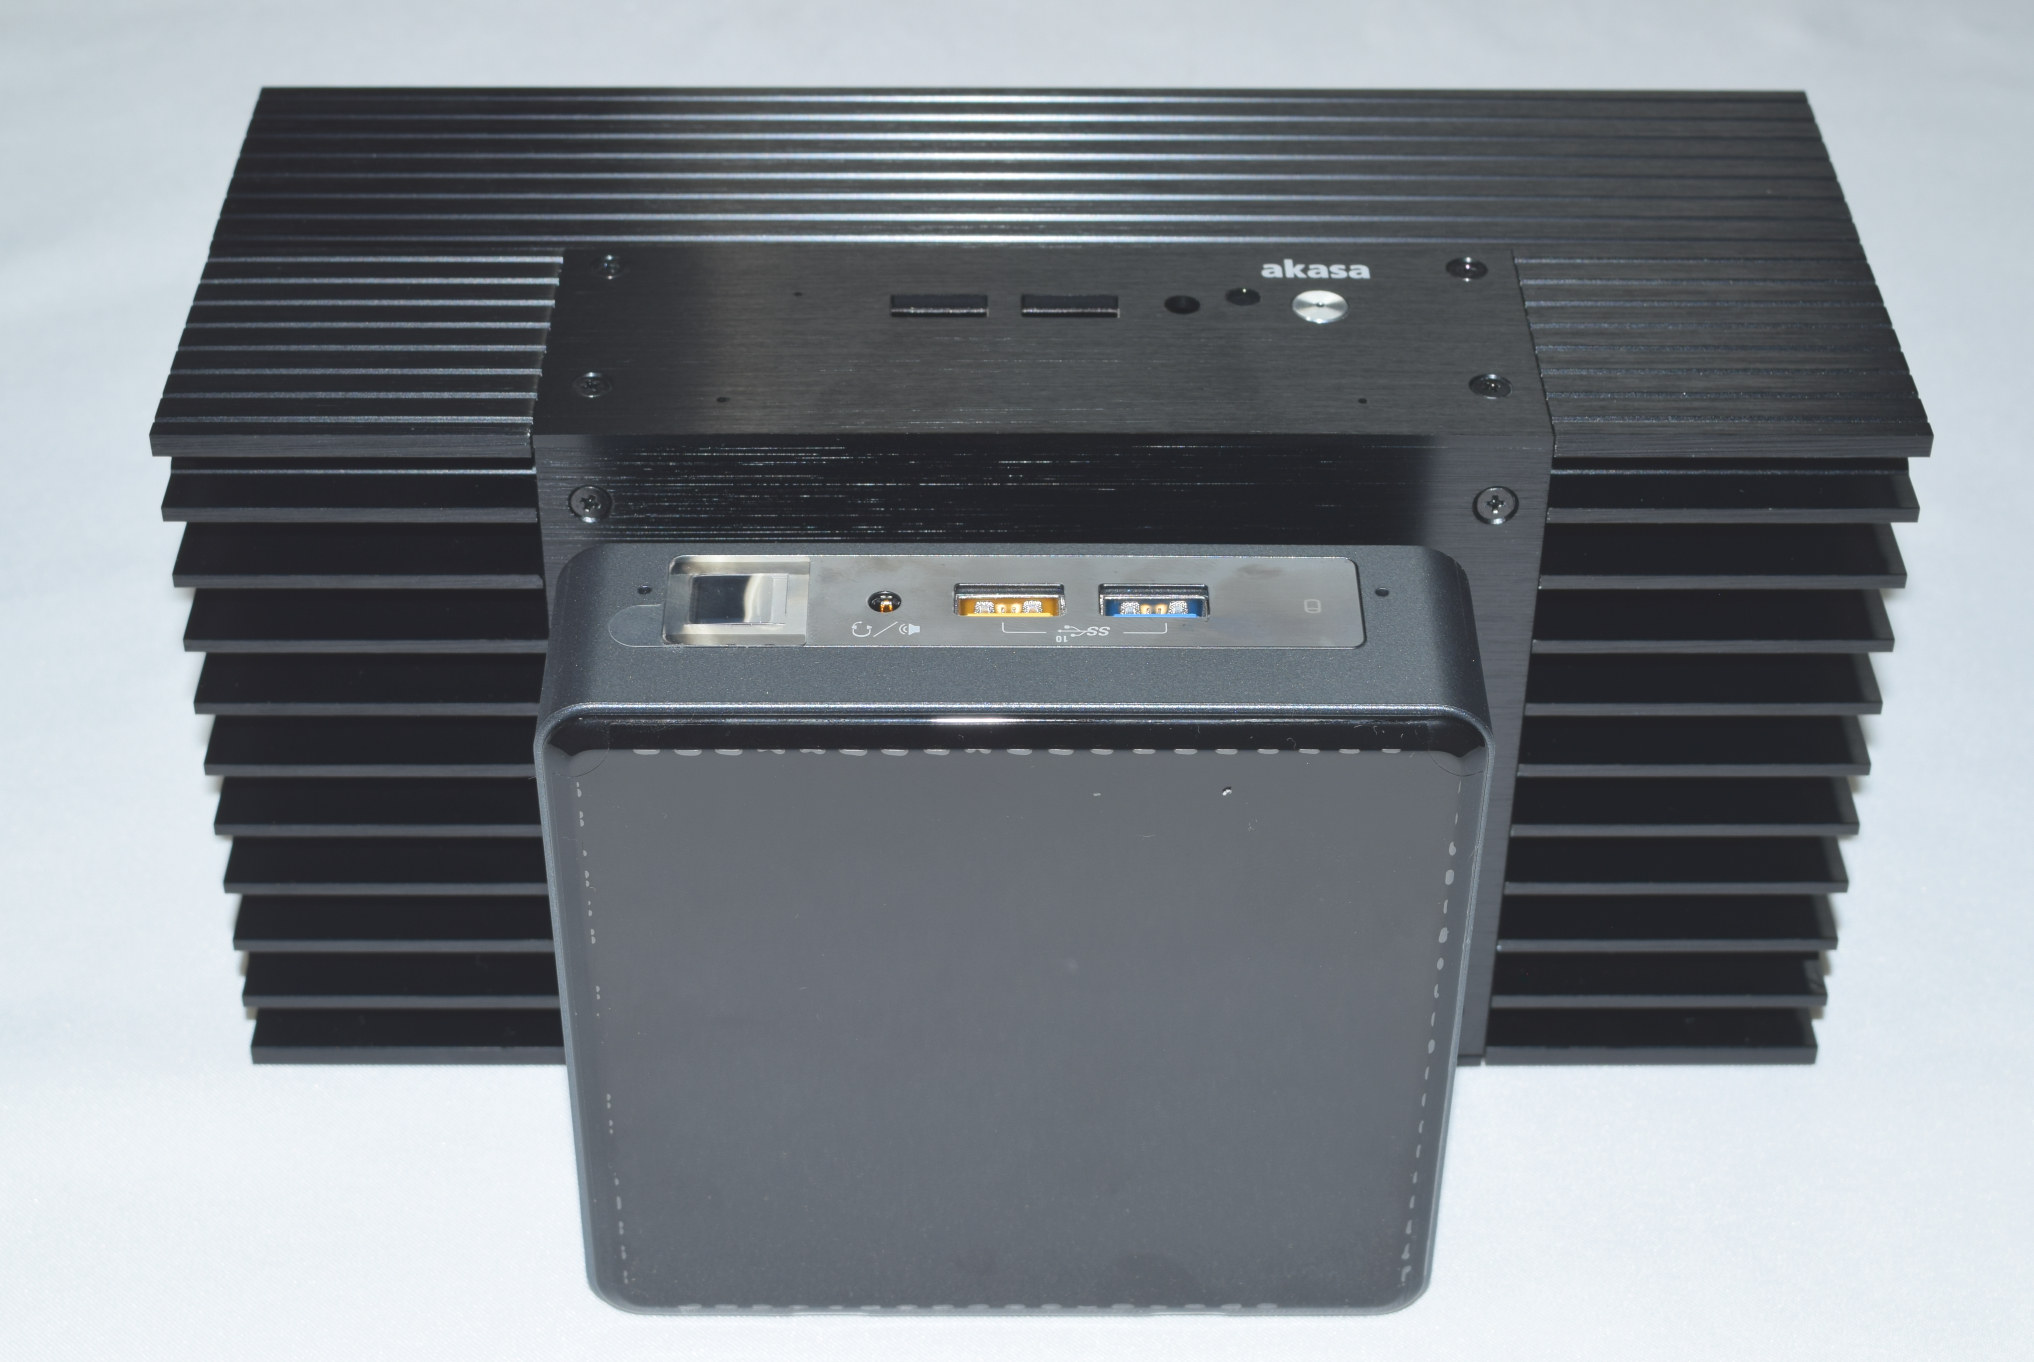
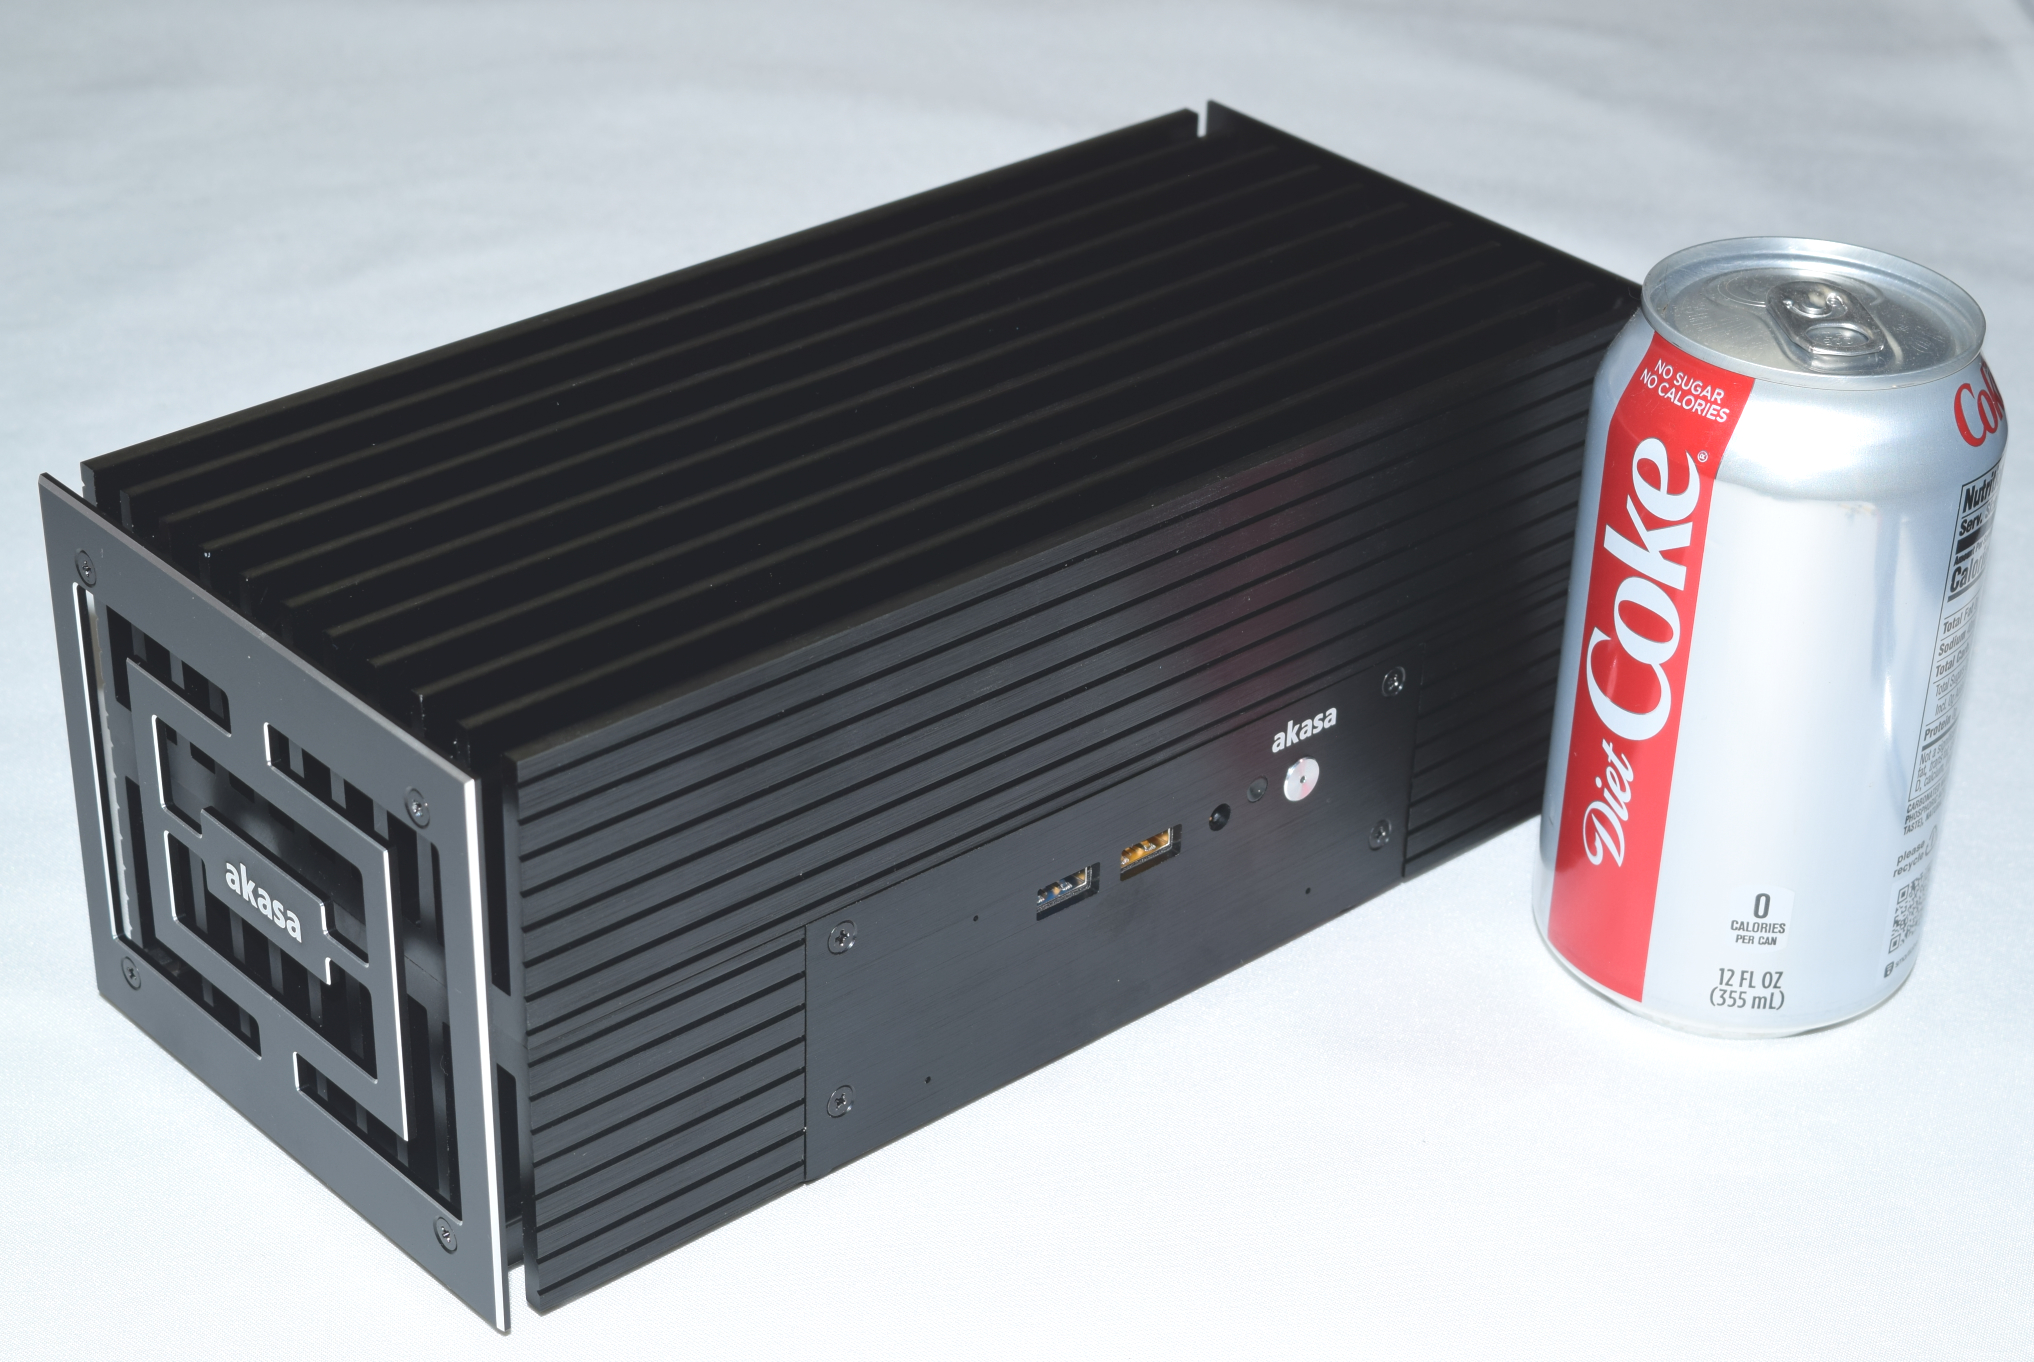
Size Comparison of NUC vs Akasa Turing Silent
We put the standard kit through our benchmarking process first. Following that, we disassembled the unit, and transferred the board to the Akasa Turing. The same benchmarks were processed again on the Turing build. The power consumption and thermal stress tests were performed on both units. In addition to the comparison between the actively-cooled and passively-cooled versions of the NUC8i5BEB, we also consider some of the other passively cooled PCs reviewed earlier, as well as a couple of other recent UCFF NUCs. In the table below, we have an overview of the various systems that we are comparing. The relevant configuration details of the machines are provided so that readers have an understanding of why some benchmark numbers are skewed for or against the Intel NUC8i5BEB (Akasa Turing) when we come to those sections.
| Comparative PC Configurations | ||
| Aspect | Intel NUC8i5BEB (Akasa Turing) | |
| CPU | Intel Core i5-8259U | Intel Core i5-8259U |
| GPU | Intel Iris Plus Graphics 655 | Intel Iris Plus Graphics 655 |
| RAM | G.Skill Ripjaws F4-2400C16-8GRS DDR4 SODIMM 16-16-16-40 @ 2400 MHz 2x8 GB |
G.Skill Ripjaws F4-2400C16-8GRS DDR4 SODIMM 16-16-16-40 @ 2400 MHz 2x8 GB |
| Storage | Western Digital WD Blue WDS500G1B0C (500 GB; M.2 2280 PCIe 3.0 x2; SanDisk 64L 3D TLC) |
Western Digital WD Blue WDS500G1B0C (500 GB; M.2 2280 PCIe 3.0 x2; SanDisk 64L 3D TLC) |
| Wi-Fi | Intel Dual Band Wireless-AC 9560 (2x2 802.11ac - 1733 Mbps) (Not usable - Missing antennae) |
Intel Dual Band Wireless-AC 9560 (2x2 802.11ac - 1733 Mbps) (Not usable - Missing antennae) |
| Price (in USD, when built) | $314 (barebones) $134 (Akasa Turing kit) $568 (as configured) |
$314 (barebones) $134 (Akasa Turing kit) $568 (as configured) |
Prior to a discussion of the performance characteristics of the passively-cooled configuration, it is worthwhile to take a look at the build process for the machine. This is followed by a couple of sections devoted to the benchmark numbers for various workloads in order to determine if going the fanless route entails leaving out some performance potential on the table. A section on the HTPC aspects and a detailed discussion of the power consumption and thermal performance of the build precedes the concluding remarks.
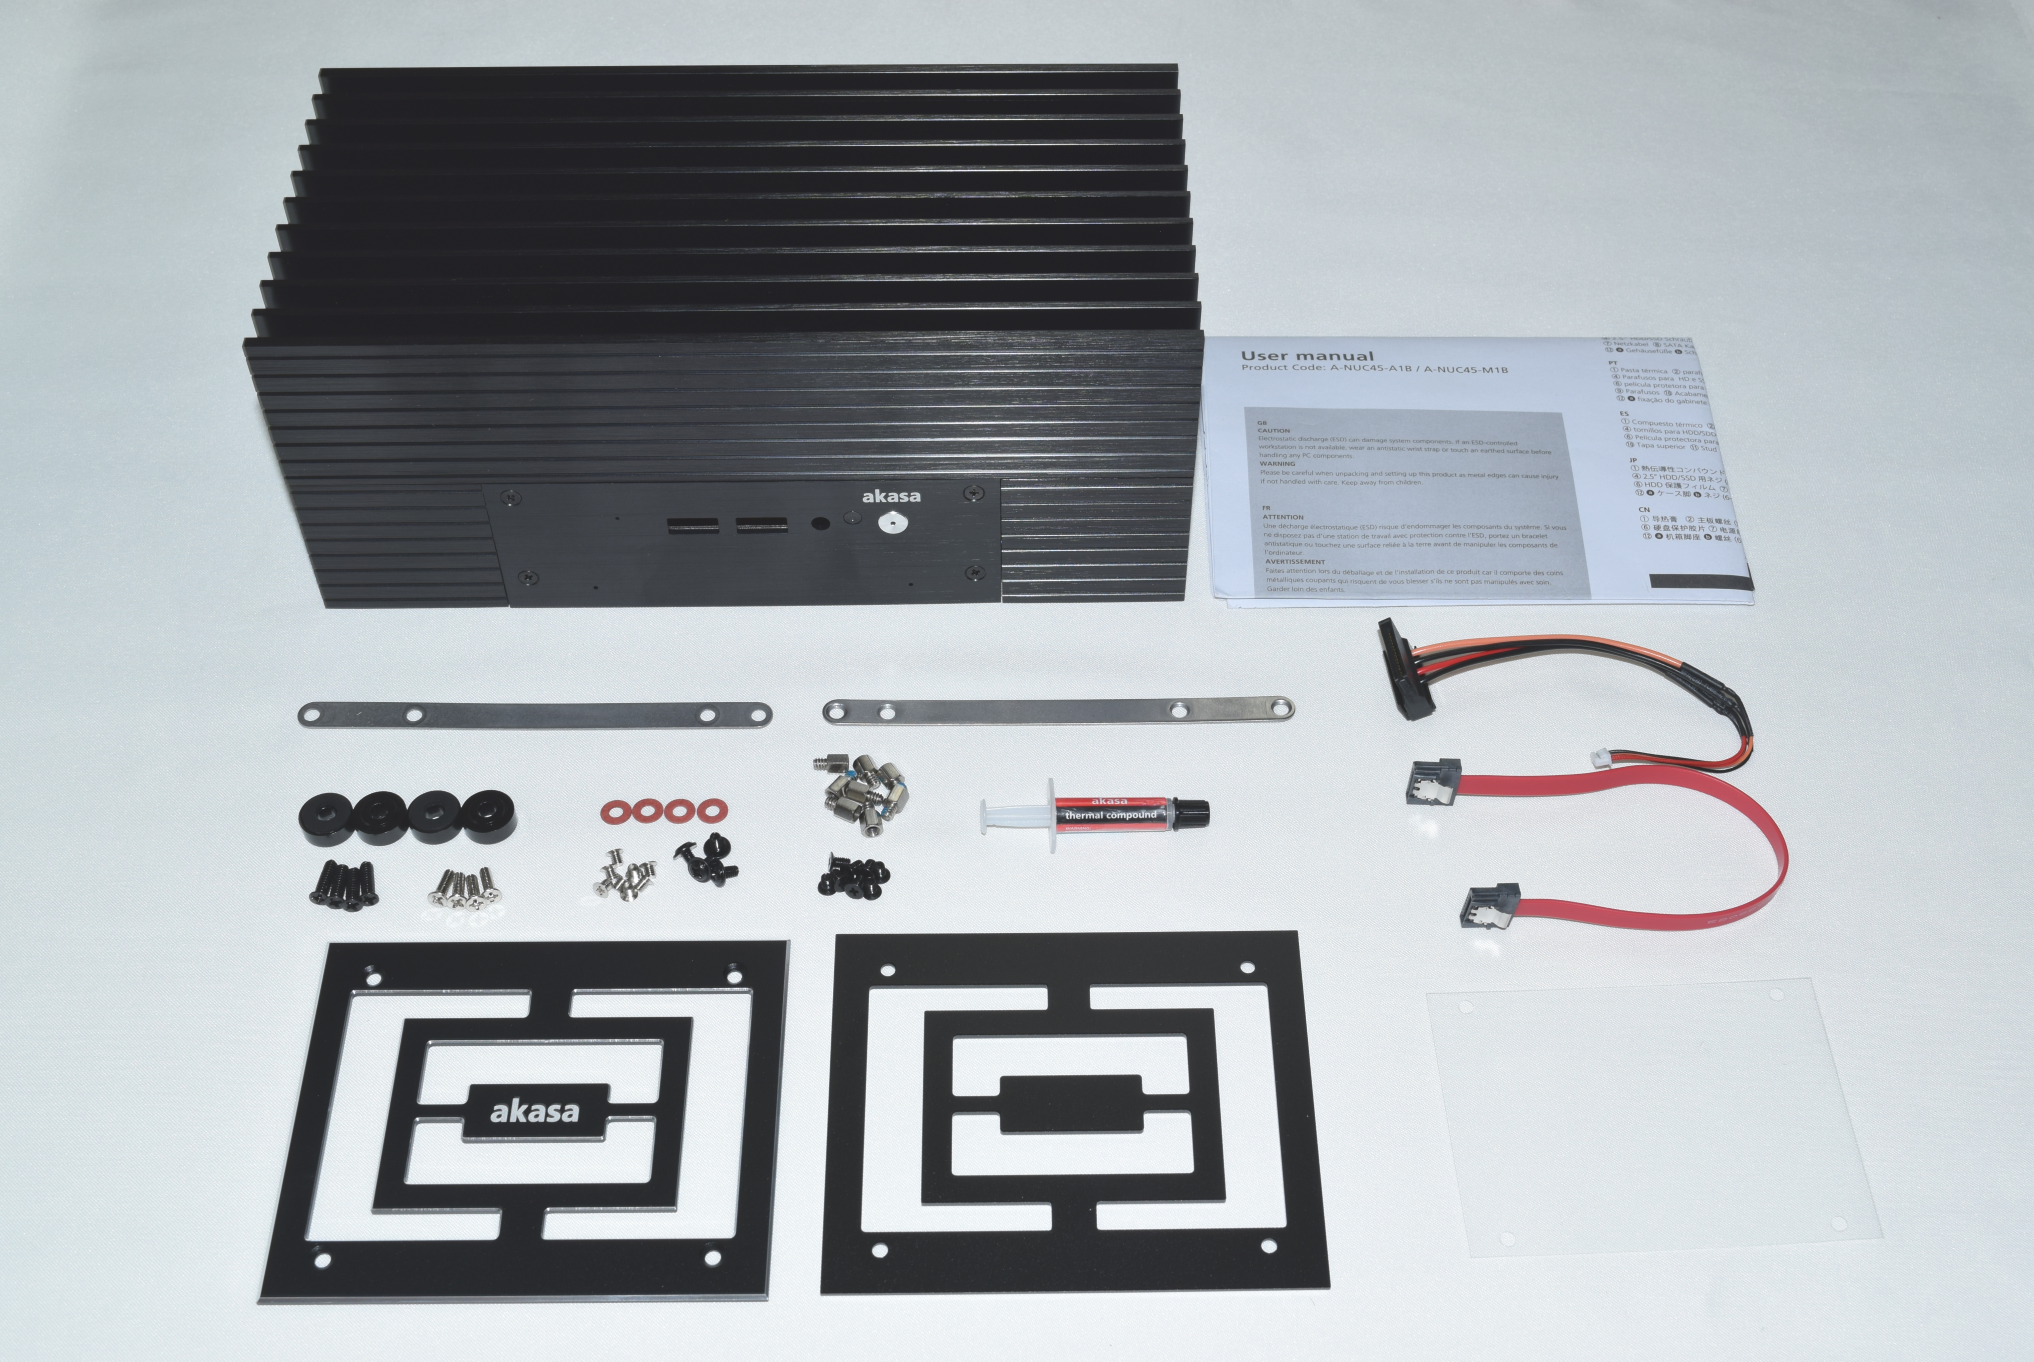
The Akasa Turing package consists of the main chassis, an user manual with installation instructions, SATA data and power cables along with mounting brackets for a 2.5" drive, thermal compound, various screws for different components, four rubber feet, and the two optional panels (for the sides, when oriented horizontally, and for the base, when oriented vertically).
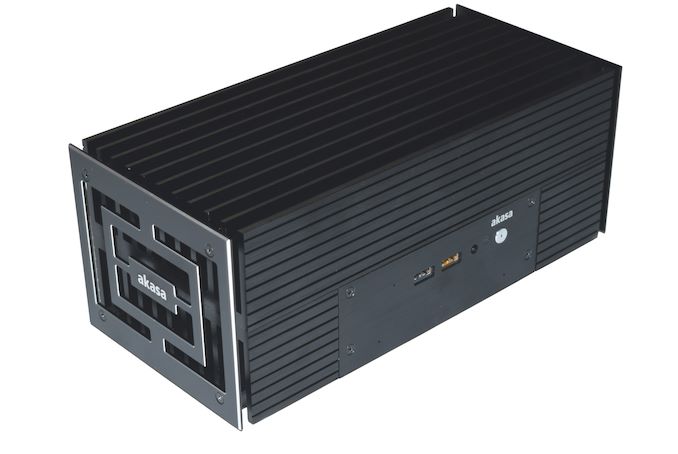
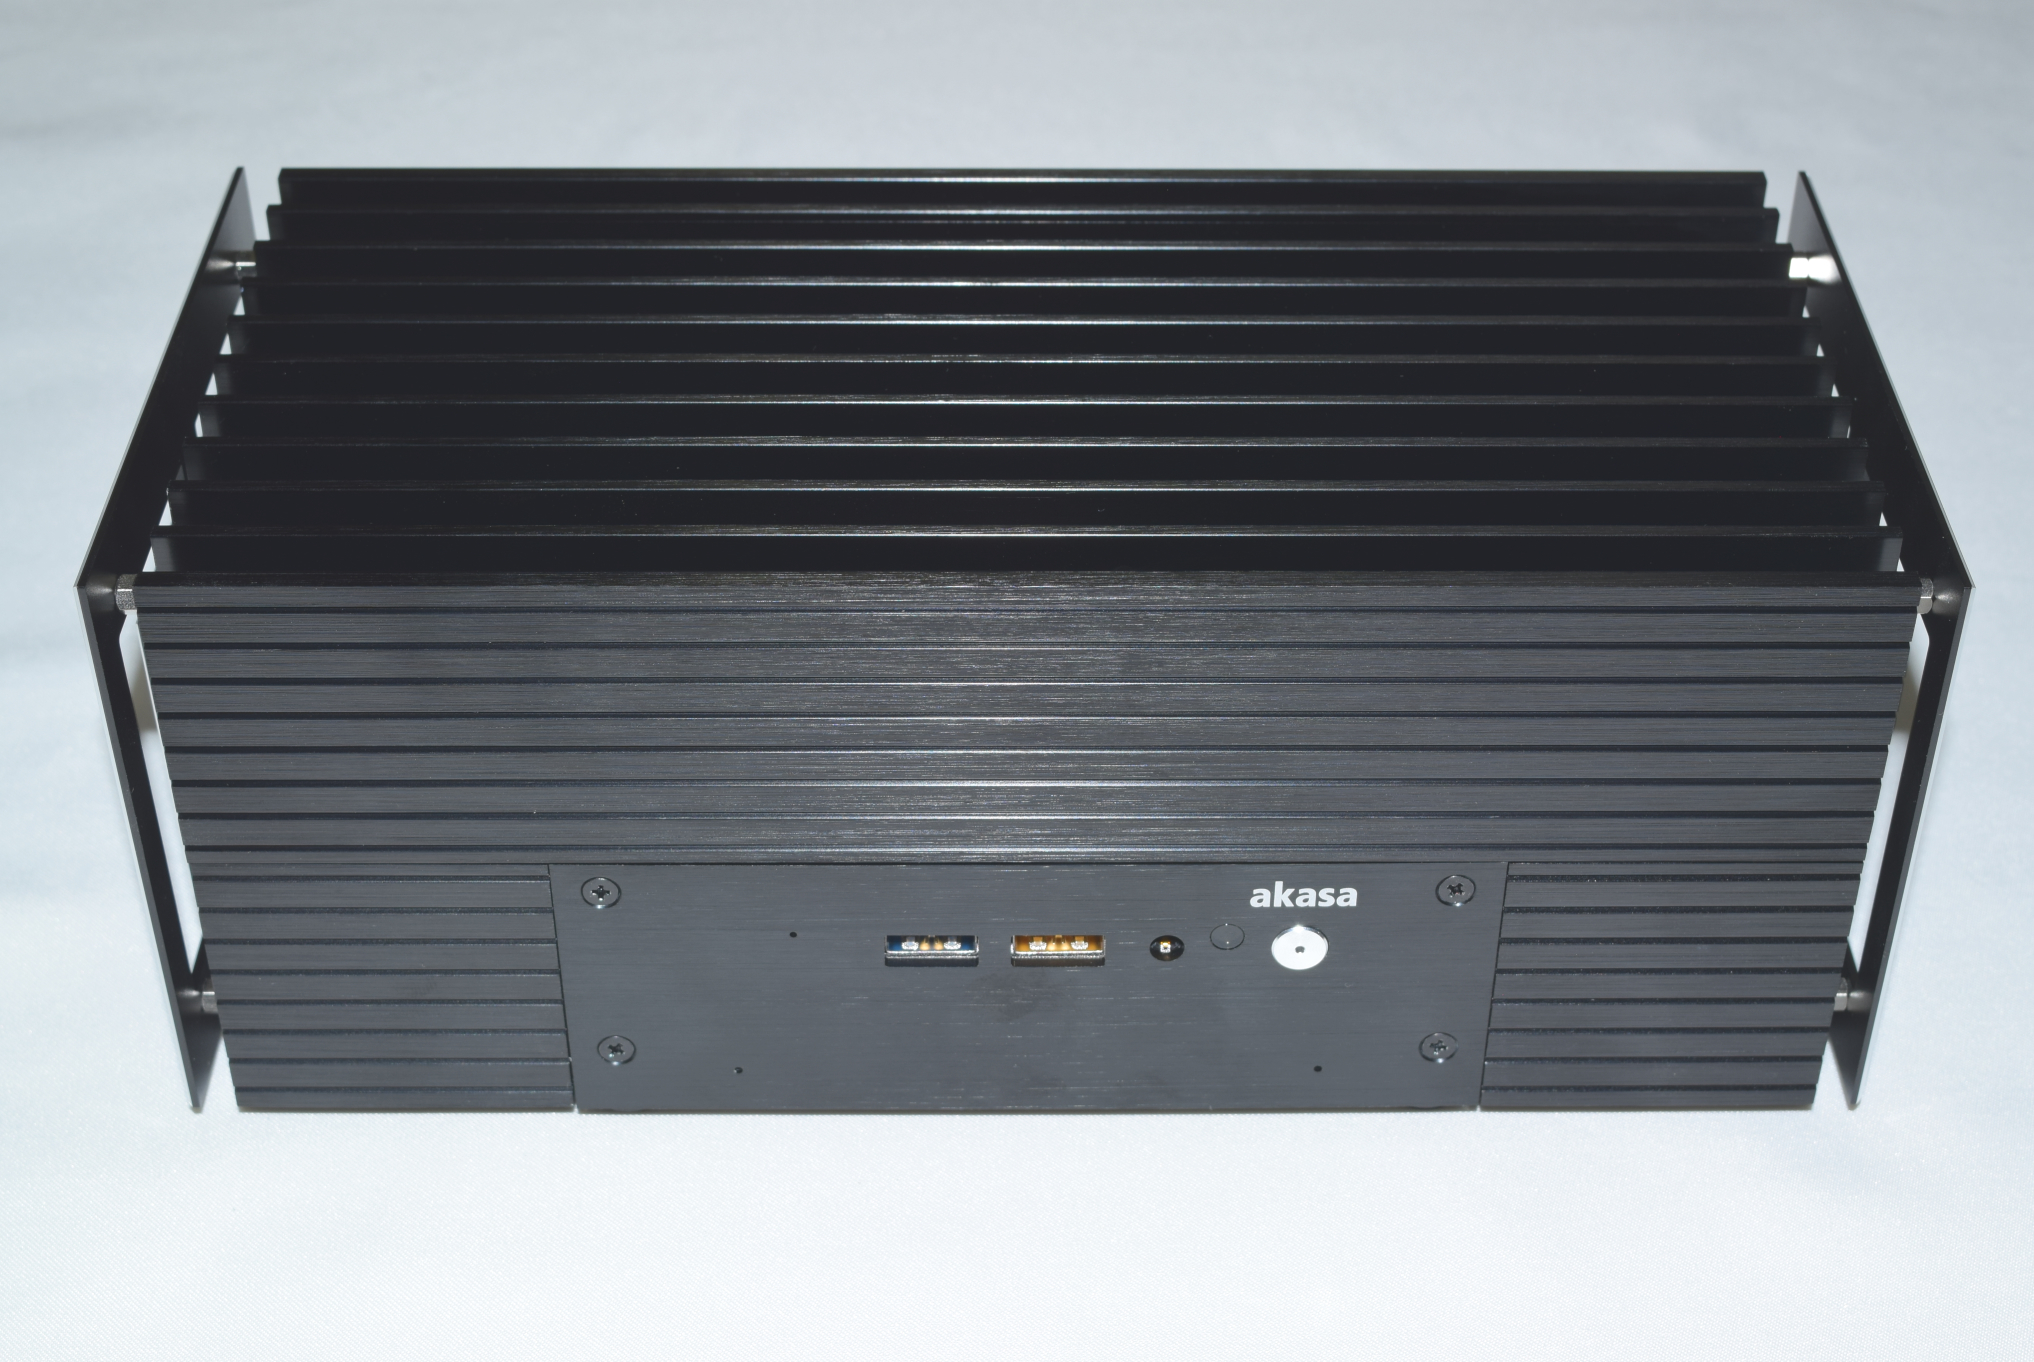
The gallery below includes photographs of the chassis from various angles. We see the front, bottom, and rear panels getting connected to the main chassis using screws that come pre-mounted. The core structure of the heat sink is visible from the side, where tall and thick fins (eleven in number, including the front and rear of the chassis) are arranged all along the length of the unit. The second and ninth fins have riser mounting holes for the optional side panels installation.


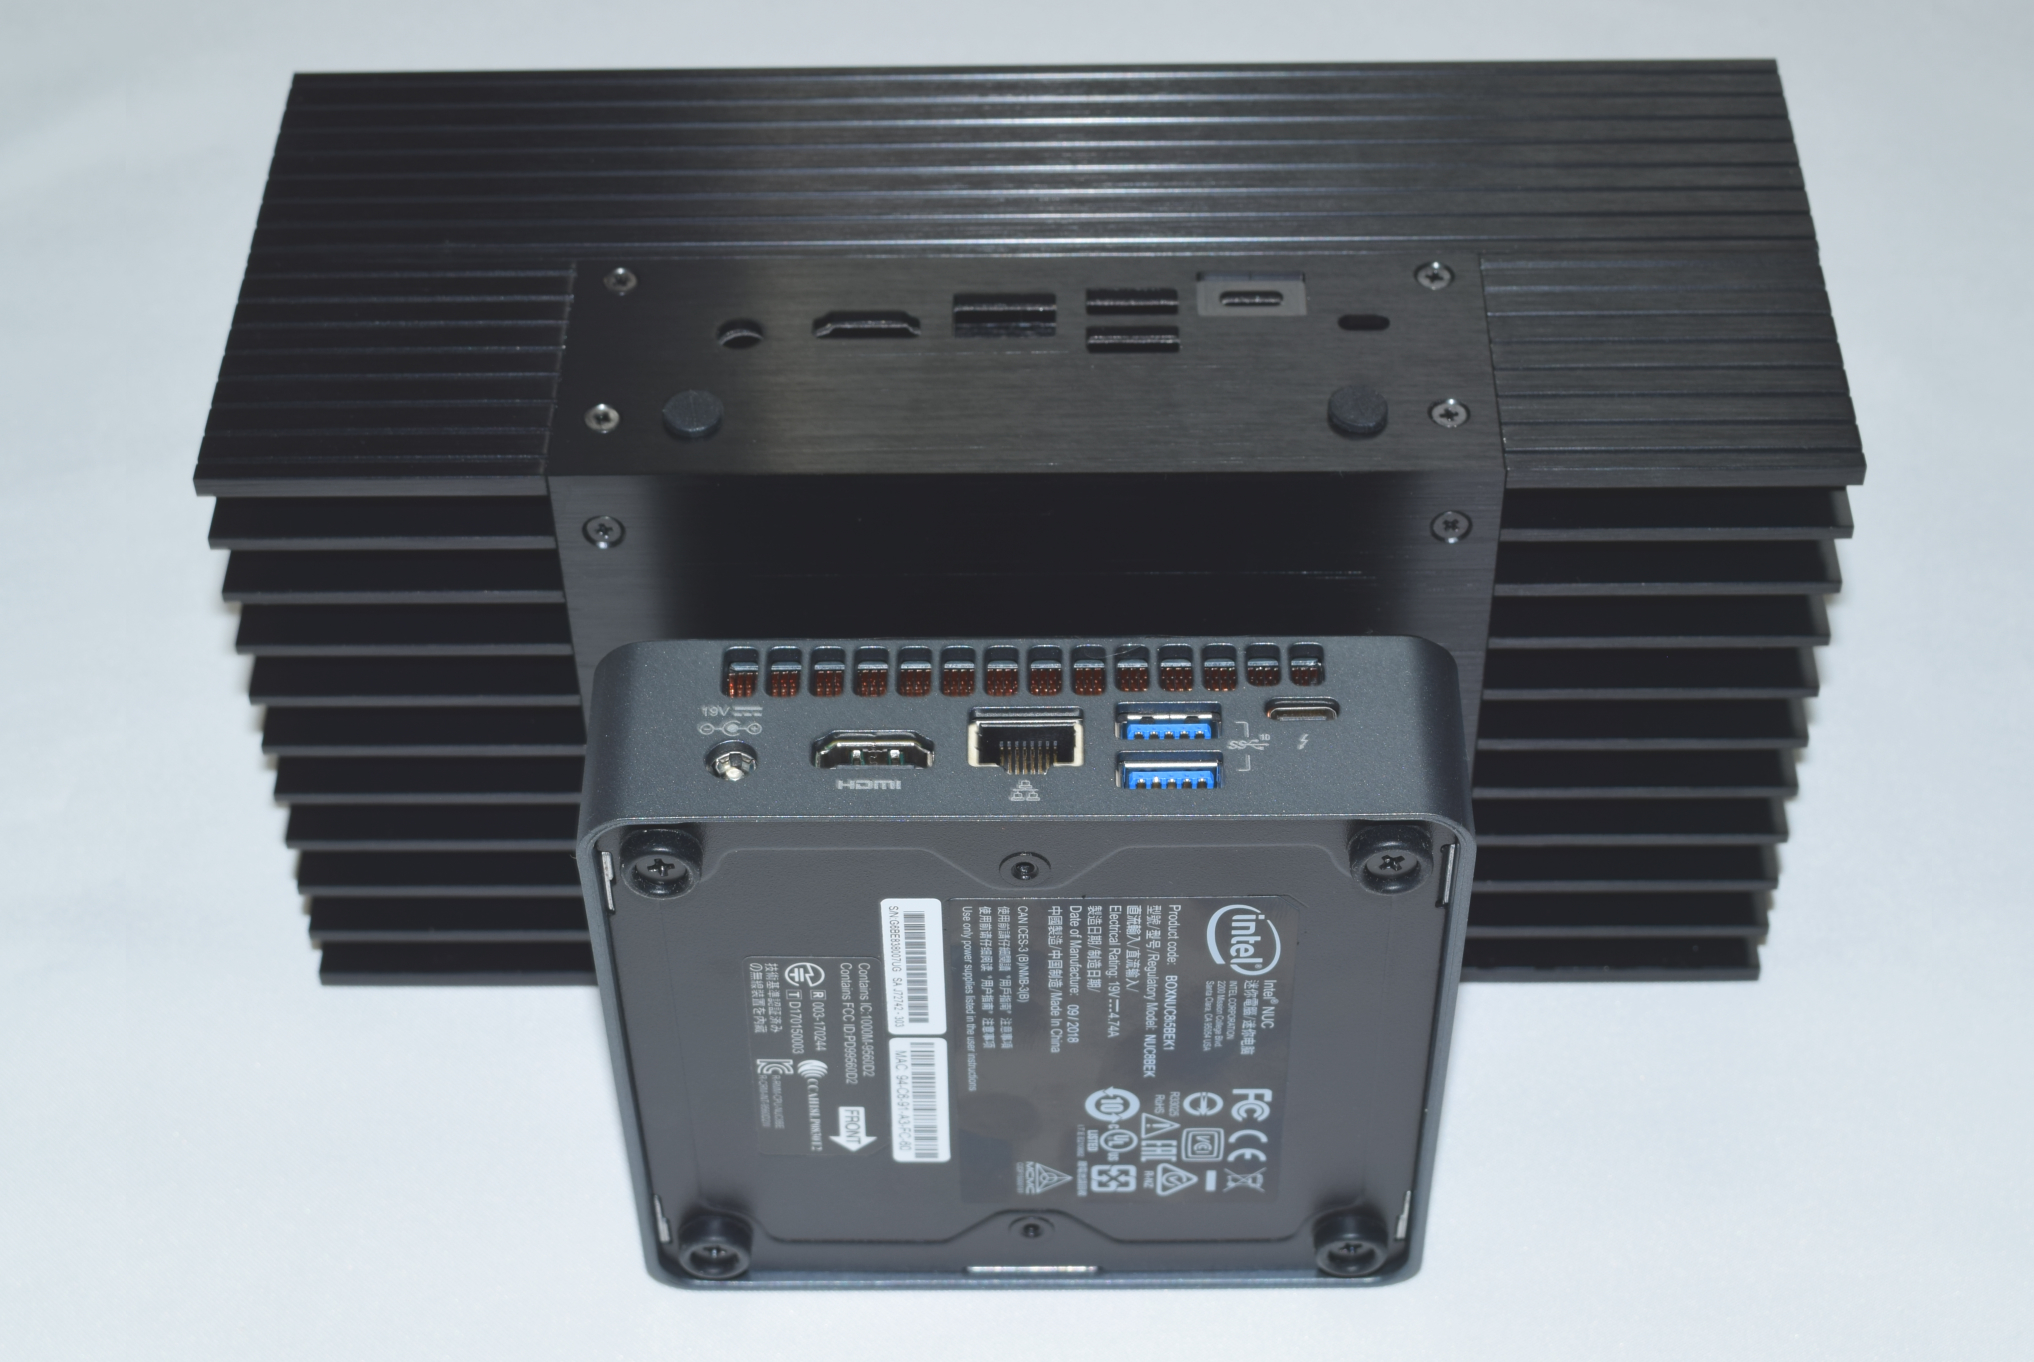
The cut-outs in the front and rear of the main chassis match the I/O ports of the standard kit. Note that the holes for the DMICs on the Akasa Turing have a slightly different alignment.
In the rear panel, the Thunderbolt 3 port is slightly recessed in the Turing chassis. Another difference is the presence of two antennae mounting holes. Their usage is optional. By default, they are covered with push-in bumpers as shown in the photograph below.
Unless one is starting off with the board version of the NUC, the standard NUC kit first needs to be subject to a teardown before starting the assembly with the Akasa Turing. The gallery below pictorially presents the teardown steps for the NUC8i5BEK.


The first step involves the removal of the kit's bottom panel. This is followed by the dismounting of any installed RAM and storage drives. Prior to removing the other screws that keep the board attached to the chassis, it is helpful to take out the top panel. This is held in place by plastic tabs that need to be skilfully pried apart using a credit card or any similar flat tool. Right underneath the top panel, four mounting screws keep the shroud for the cooling solution and its plastic frame connected to the chassis. These need to be taken out for the board to be prepared for removal from the kit. The only remaining wires attached to the chassis would be the DMICs and the WLAN antennae. These are attached to the chassis using tape /glue, and are fairly easy to separate out. The WLAN antennae can't be re-used in the passive build, but the DMICs assembly can be transferred as-is.
The next set of steps in the gallery below pictorially depicts the preparation of the motherboard for installation in the Turing chassis.


The fan assembly needs to be removed from the main board, and the first step is to disconnect the wires connected to the board's fan header. Loosening the three screws attaching the fan to the board and the heat sink reveals the dual flat heat pipe and heat spreader assembly. This is mounted on the board using four screws near the four corners of the Core i5-8259U package. Taking out the heat pipes and spreader reveals the three components of the package - while the main processor die interfaces with the heat pipes assembly using thermal paste, the eDRAM and the PCH only use thermal pads.
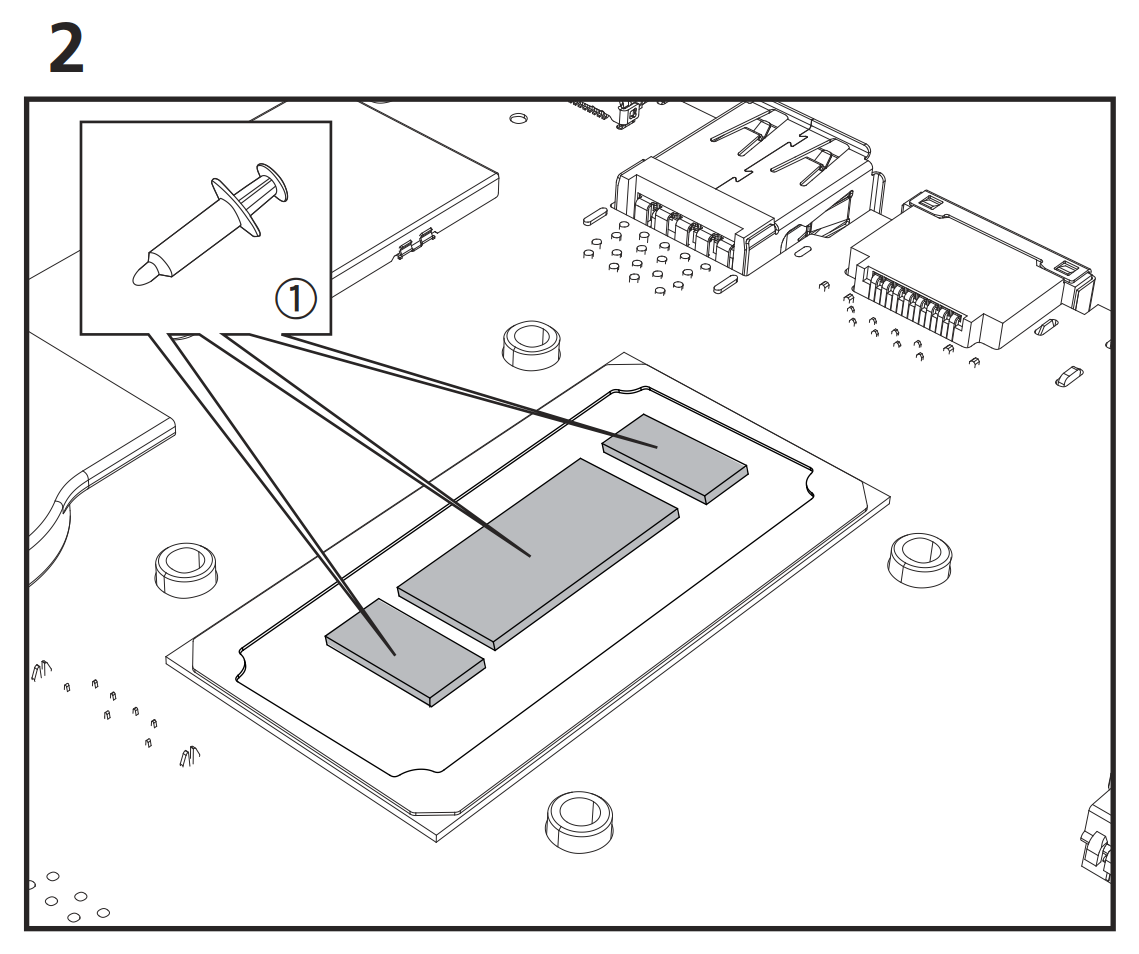
The next step involves the removal of the thermal pads on the eDRAM and PCH dies, and cleaning up the existing thermal paste using rubbing alcohol or some other cleaning agent. This is to be followed by the application of Akasa's thermal compound on all three package components. Due to an issue with the installation manual provided along with our early kit, we made a slight error in our first pass, as shown below.
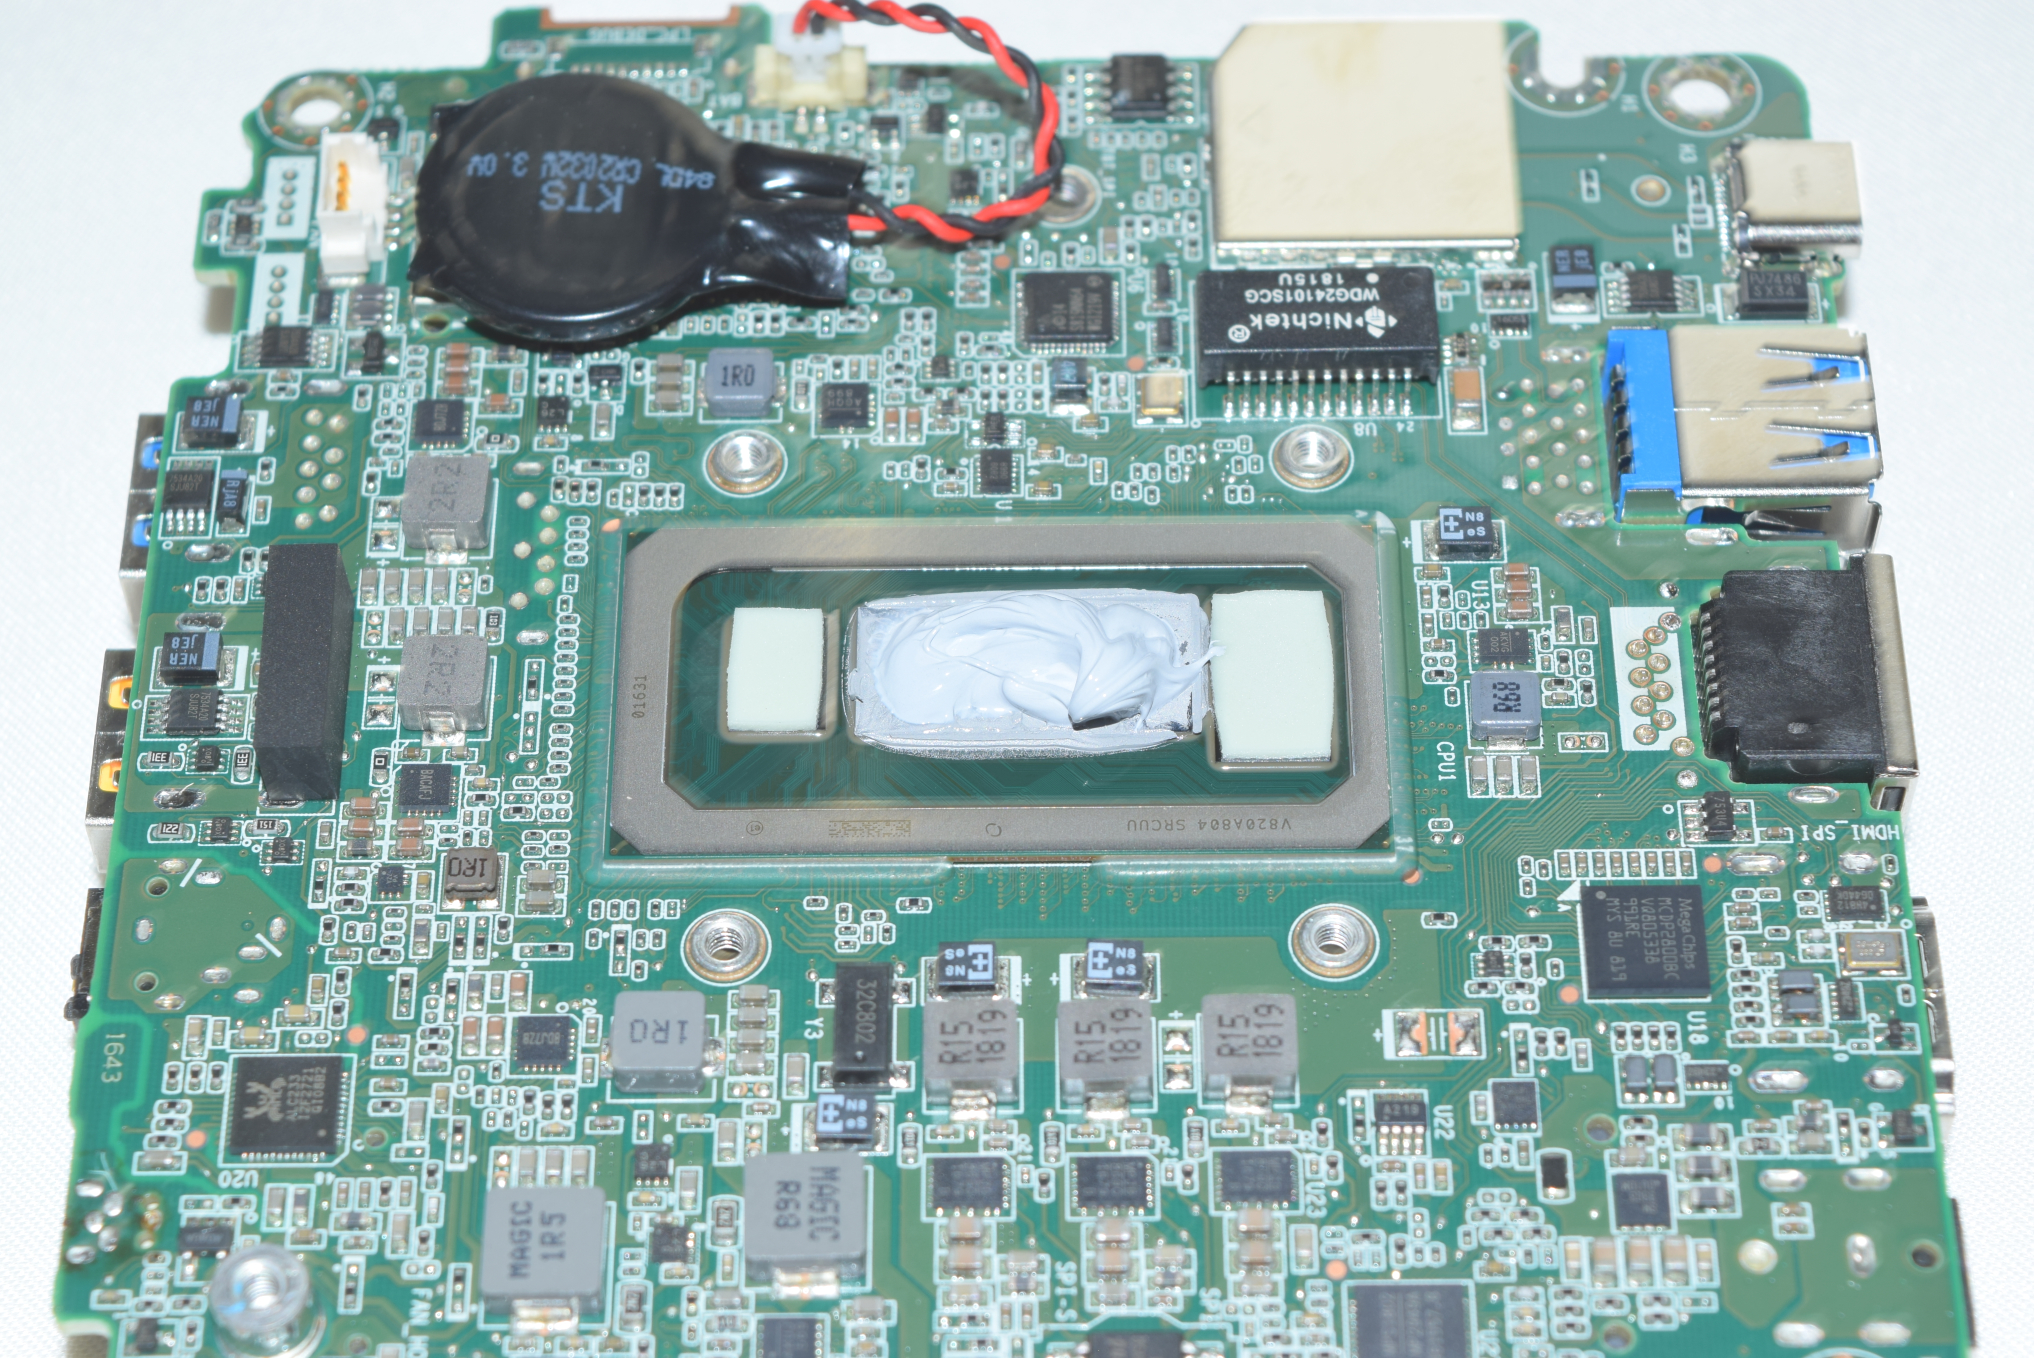
Do not do this!
The result was that our passive build operated fine for the most part - However, when running Furmark and/or 3DMark workloads, the system would randomly turn itself off. After disassembling the unit and correcting the thermal paste application as shown in the manual extract below, the system managed to complete our rigorous stress tests with aplomb.
The gallery below presents the preparation of the Turing chassis for the installation of the board prepared above. The front and bottom panels need to be unscrewed. This reveals the solid metal block connecting the SiP to the rest of the massive heat sink doubling up as the chassis. Four risers are pre-mounted to enable the orientation of the NUC board after alignment of the read I/O ports with the rear panel.


A pictorial representation of the remaining steps in the installation of the board in the Turing chassis is provided in the gallery below. Four specific screws with the red washers help secure the NUC board to the four pre-mounted risers mentioned earlier. The next step involves the transfer of the DMICs assembly to the back side of the front panel. Care needs to be taken to align the microphones to the appropriate holes in the panel. A dry run of installing a 2.5" drive in the system was also performed - this involves the connection of the supplied SATA data and power cables to the board, and the mounting of the drive to the brackets. Prior to connecting the mounted drive to the cables from the main board, the DMICs assembly and the M.2 SSD and DRAM were connected again.


The SATA drive assembly is mounted to the chassis frame using four additional screws, and this is followed by the re-mounting of the bottom panel along with the rubber feet. The system is ready for use after this, unless the side panels are required. Subjectively speaking, the side panels do enhance the look of the system. Mounting these requires the screwing in of four risers on each side. The panels are then tagged on to these risers.
Overall, the build process is quite smooth for folks used to building PCs from scratch. For others, the detailed instructions are quite helpful, though a reference to a few build videos or write-ups similar to the one in this section may be necessary. The supplied manual does not include the disassembly instructions for the original kit - an aspect that is also addressed in the above section.
The Intel NUC8i5BEB (Akasa Turing) was evaluated using our Fall 2018 test suite for small-form factor PCs. In the first section, we look at BAPCo's SYSmark and various UL benchmarks.
BAPCo SYSmark 2018
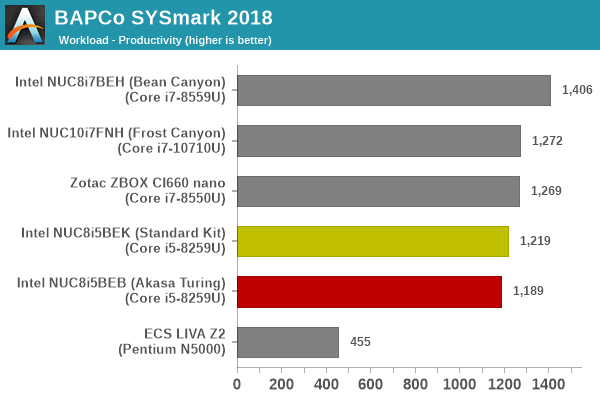
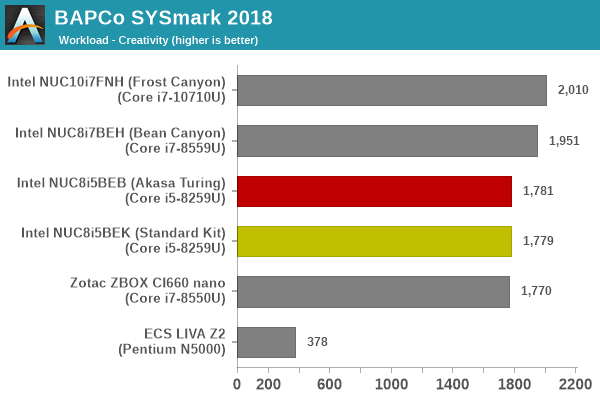
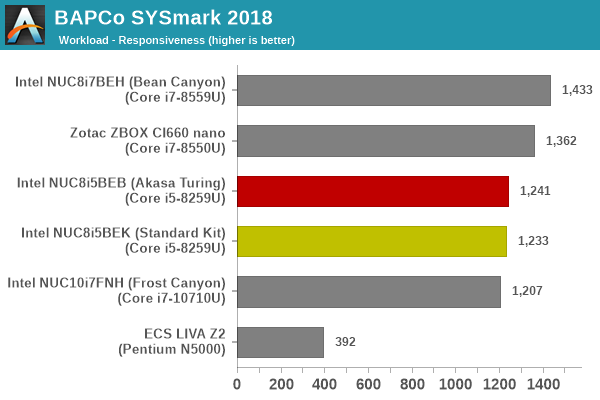
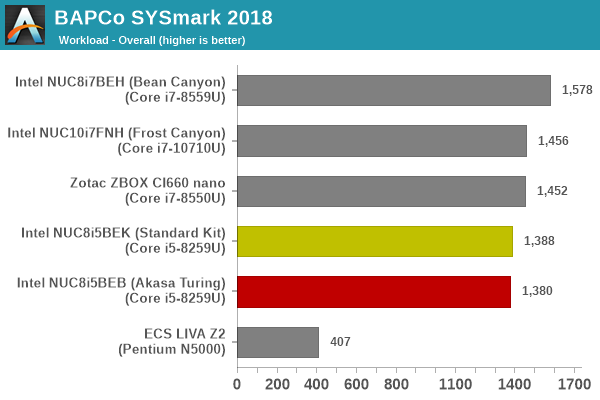
BAPCo's SYSmark 2018 is an application-based benchmark that uses real-world applications to replay usage patterns of business users in the areas of productivity, creativity, and responsiveness. SYSmark 25 was released recently, but the Turing build was benchmarked prior to its release.The 'Productivity Scenario' covers office-centric activities including word processing, spreadsheet usage, financial analysis, software development, application installation, file compression, and e-mail management. The 'Creativity Scenario' represents media-centric activities such as digital photo processing, AI and ML for face recognition in photos and videos for the purpose of content creation, etc. The 'Responsiveness Scenario' evaluates the ability of the system to react in a quick manner to user inputs in areas such as application and file launches, web browsing, and multi-tasking.
Scores are meant to be compared against a reference desktop (the SYSmark 2018 calibration system, a Dell Optiplex 5050 tower with a Core i3-7100 and 4GB of DDR4-2133 memory to go with a 128GB M.2 SATA III SSD). The calibration system scores 1000 in each of the scenarios. A score of, say, 2000, would imply that the system under test is twice as fast as the reference system.
SYSmark 2018 also adds energy measurement to the mix. A high score in the SYSmark benchmarks might be nice to have, but, potential customers also need to determine the balance between power consumption and the efficiency of the system. For example, in the average office scenario, it might not be worth purchasing a noisy and power-hungry PC just because it ends up with a 2000 score in the SYSmark 2014 SE benchmarks. In order to provide a balanced perspective, SYSmark 2018 also allows vendors and decision makers to track the energy consumption during each workload. In the graphs below, we find the total energy consumed by the PC under test for a single iteration of each SYSmark 2018 workload. For reference, the calibration system consumes 5.36 Wh for productivity, 7.71 Wh for creativity, 5.61 Wh for responsiveness, and 18.68 Wh overall.
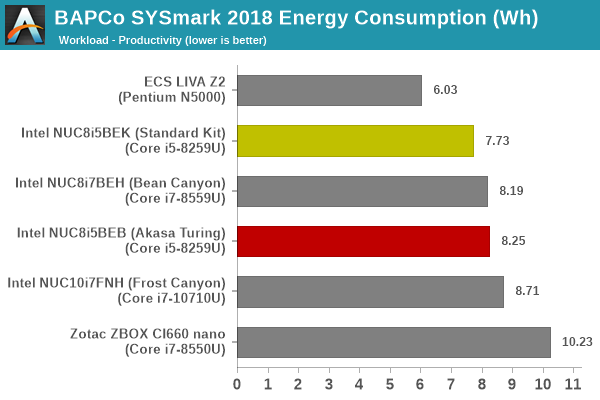
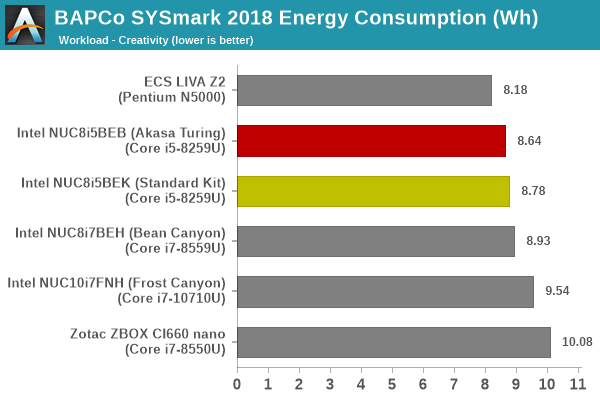
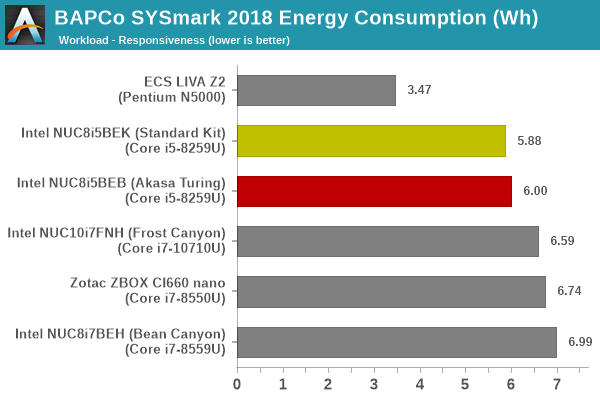
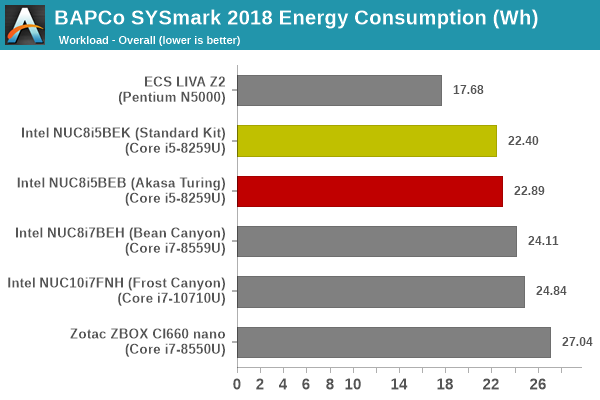
For the most part, the scores of the passively-cooled and actively-cooled versions closely track each other. In the overall energy consumption, we actually see the standard kit being more efficient - in part due to the completion of the tasks in a slightly faster manner for some of the components.
UL Benchmarks - PCMark and 3DMark
This sub-section deals with a selection of the UL Futuremark benchmarks - PCMark 10, PCMark 8, and 3DMark. While the first two evaluate the system as a whole, 3DMark focuses on the graphics capabilities.
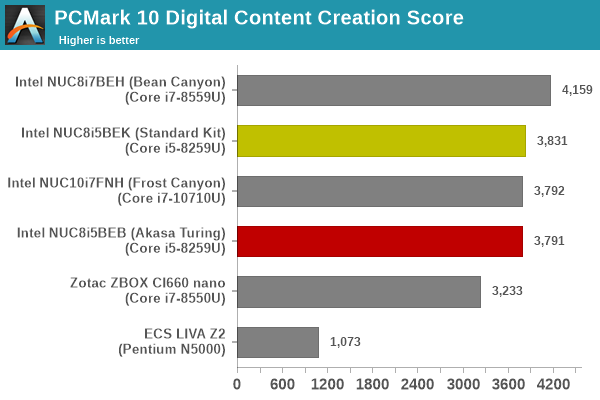
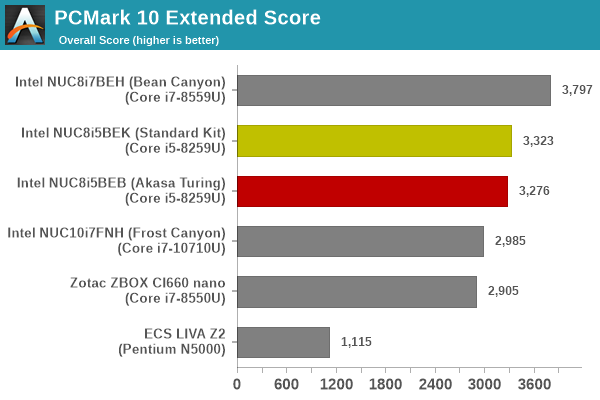
PCMark 10
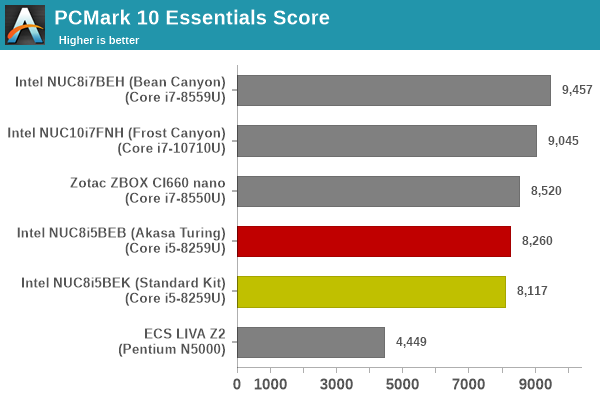
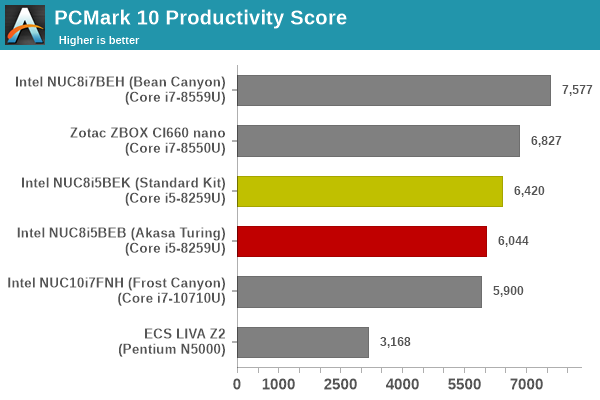
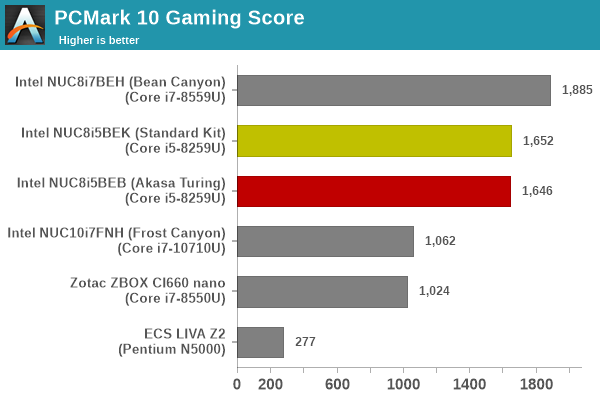
UL's PCMark 10 evaluates computing systems for various usage scenarios (generic / essential tasks such as web browsing and starting up applications, productivity tasks such as editing spreadsheets and documents, gaming, and digital content creation). We benchmarked select PCs with the PCMark 10 Extended profile and recorded the scores for various scenarios. These scores are heavily influenced by the CPU and GPU in the system, though the RAM and storage device also play a part. The power plan was set to Balanced for all the PCs while processing the PCMark 10 benchmark.
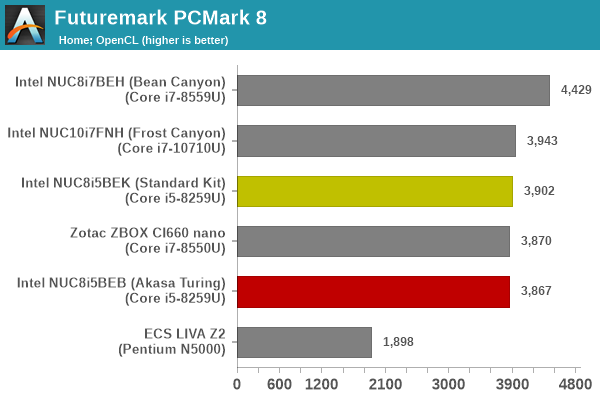
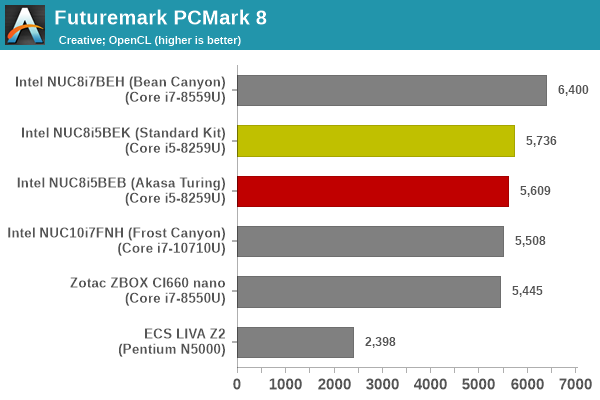
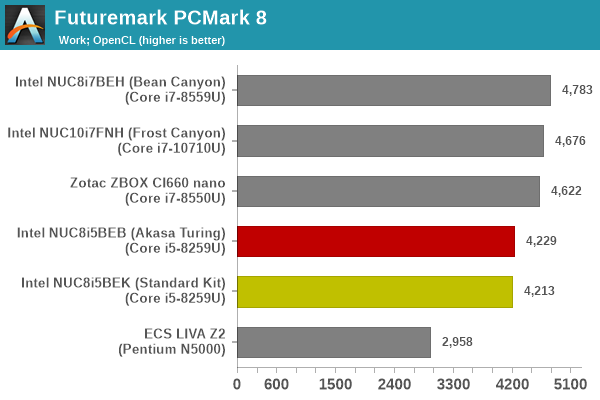
PCMark 8
We continue to present PCMark 8 benchmark results (as those have more comparison points) while our PCMark 10 scores database for systems grows in size. PCMark 8 provides various usage scenarios (home, creative and work) and offers ways to benchmark both baseline (CPU-only) as well as OpenCL accelerated (CPU + GPU) performance. We benchmarked select PCs for the OpenCL accelerated performance in all three usage scenarios. These scores are heavily influenced by the CPU in the system. Again, the standard kit and the Turing perform fairly similarly, with the actively-cooled kit getting a slight edge for most components.
3DMark
UL's 3DMark comes with a diverse set of graphics workloads that target different Direct3D feature levels. Correspondingly, the rendering resolutions are also different. We use 3DMark 2.4.4264 to get an idea of the graphics capabilities of the system. In this section, we take a look at the performance of the Intel NUC8i5BEB (Akasa Turing) across the different 3DMark workloads.
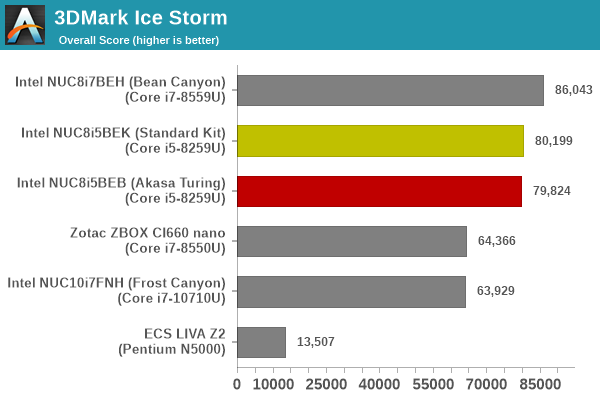
3DMark Ice Storm
This workload has three levels of varying complexity - the vanilla Ice Storm, Ice Storm Unlimited, and Ice Storm Extreme. It is a cross-platform benchmark (which means that the scores can be compared across different tablets and smartphones as well). All three use DirectX 11 (feature level 9) / OpenGL ES 2.0. While the Extreme renders at 1920 x 1080, the other two render at 1280 x 720. The graphs below present the various Ice Storm worloads' numbers for different systems that we have evaluated.
| UL 3DMark - Ice Storm Workloads | |||
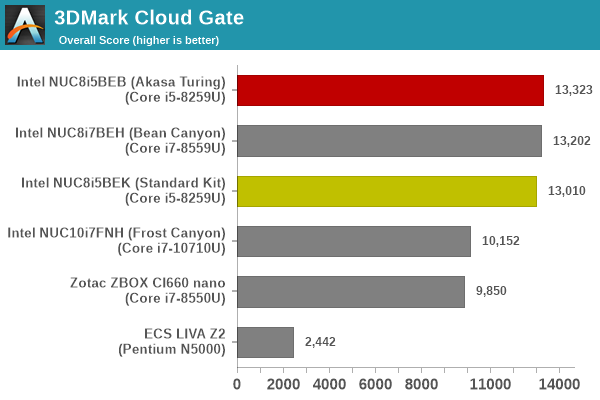
3DMark Cloud Gate
The Cloud Gate workload is meant for notebooks and typical home PCs, and uses DirectX 11 (feature level 10) to render frames at 1280 x 720. The graph below presents the overall score for the workload across all the systems that are being compared.
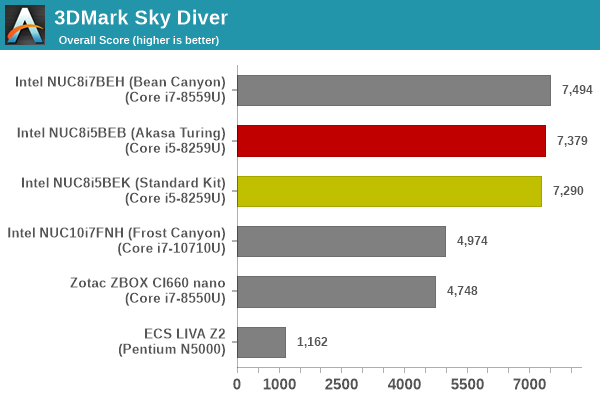
3DMark Sky Diver
The Sky Diver workload is meant for gaming notebooks and mid-range PCs, and uses DirectX 11 (feature level 11) to render frames at 1920 x 1080. The graph below presents the overall score for the workload across all the systems that are being compared.
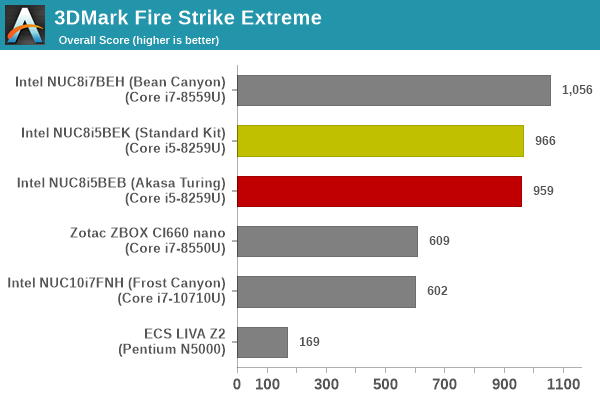
3DMark Fire Strike Extreme
The Fire Strike benchmark has three workloads. The base version is meant for high-performance gaming PCs. Similar to Sky Diver, it uses DirectX 11 (feature level 11) to render frames at 1920 x 1080. The Ultra version targets 4K gaming system, and renders at 3840 x 2160. However, we only deal with the Extreme version in our benchmarking - It renders at 2560 x 1440, and targets multi-GPU systems and overclocked PCs. The graph below presents the overall score for the Fire Strike Extreme benchmark across all the systems that are being compared.
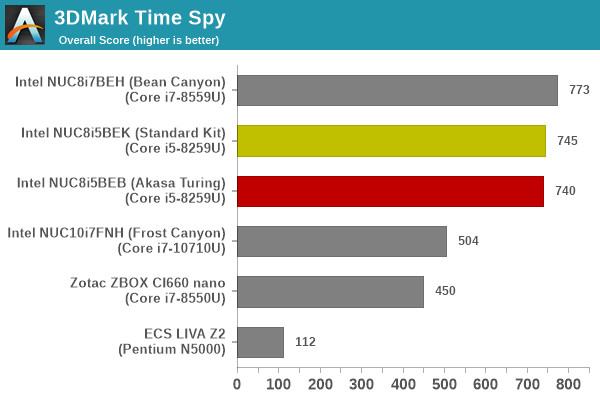
3DMark Time Spy
The Time Spy workload has two levels with different complexities. Both use DirectX 12 (feature level 11). However, the plain version targets high-performance gaming PCs with a 2560 x 1440 render resolution, while the Extreme version renders at 3840 x 2160 resolution. The graphs below present both numbers for all the systems that are being compared in this review.
| UL 3DMark - Time Spy Workloads | |||
3DMark Night Raid
The Night Raid workload is a DirectX 12 benchmark test. It is less demanding than Time Spy, and is optimized for integrated graphics. The graph below presents the overall score in this workload for different system configurations.
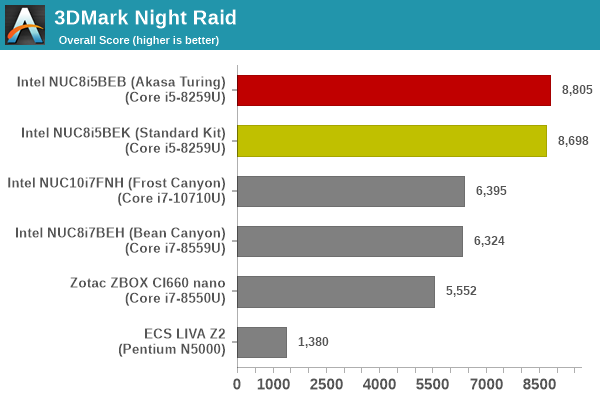
The graphics workloads show more balance - while the actively cooled version has the slight lead in some workloads, the fanless one leads in others. However, the differences across all tests are almost all within the regular run-to-run variance.
This section looks at some of the other commonly used benchmarks representative of the performance of specific real-world applications.
3D Rendering - CINEBENCH R15
We use CINEBENCH R15 for 3D rendering evaluation. The program provides three benchmark modes - OpenGL, single threaded and multi-threaded. Evaluation of different PC configurations in all three modes provided us the following results.
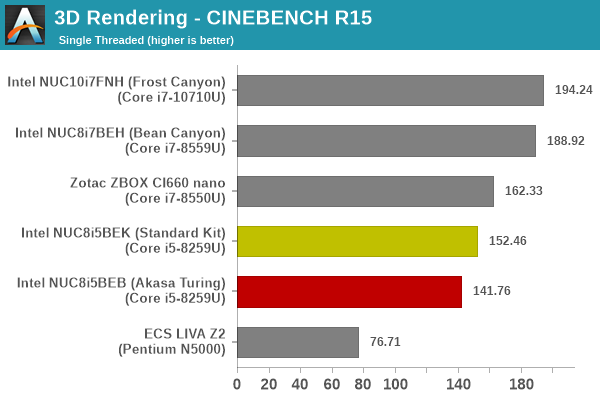
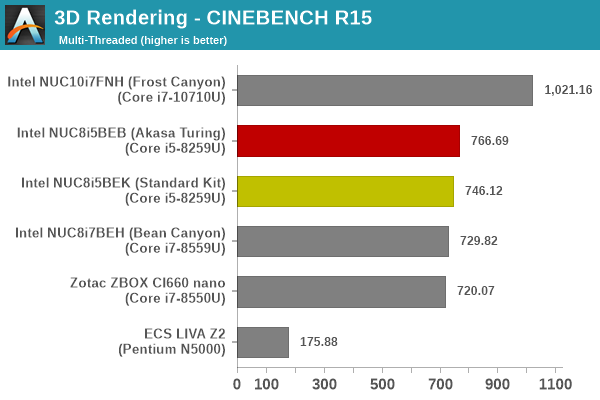
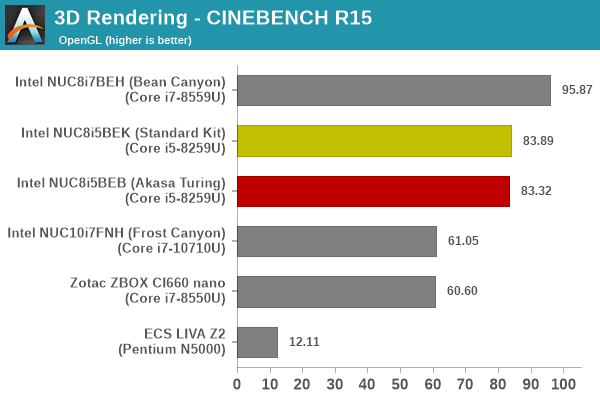
The gulf in the single-threaded score can be attributed to the actively-cooled version sustaining boost clocks for longer than the fanless version.
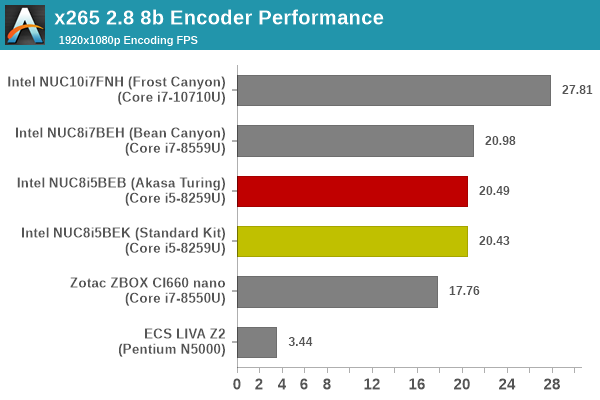
x265 Benchmark
Next up, we have some video encoding benchmarks using x265 v2.8. The appropriate encoder executable is chosen based on the supported CPU features. In the first case, we encode 600 1080p YUV 4:2:0 frames into a 1080p30 HEVC Main-profile compatible video stream at 1 Mbps and record the average number of frames encoded per second.
Our second test case is 1200 4K YUV 4:2:0 frames getting encoded into a 4Kp60 HEVC Main10-profile video stream at 35 Mbps. The encoding FPS is recorded.
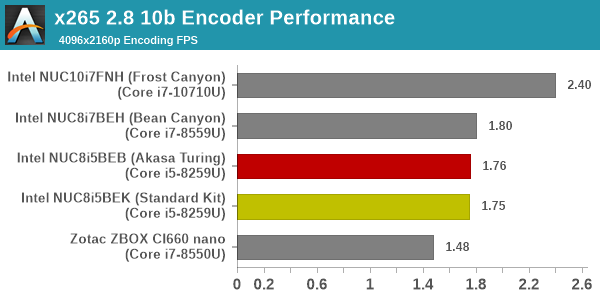
Here, we see the versions stacked much closer to each other - these results pretty much conform to what we see further down in the thermal stress section.
7-Zip
7-Zip is a very effective and efficient compression program, often beating out OpenCL accelerated commercial programs in benchmarks even while using just the CPU power. 7-Zip has a benchmarking program that provides tons of details regarding the underlying CPU's efficiency. In this subsection, we are interested in the compression and decompression rates when utilizing all the available threads for the LZMA algorithm.
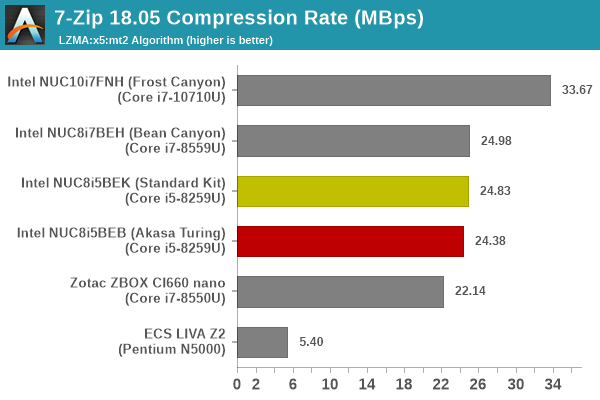
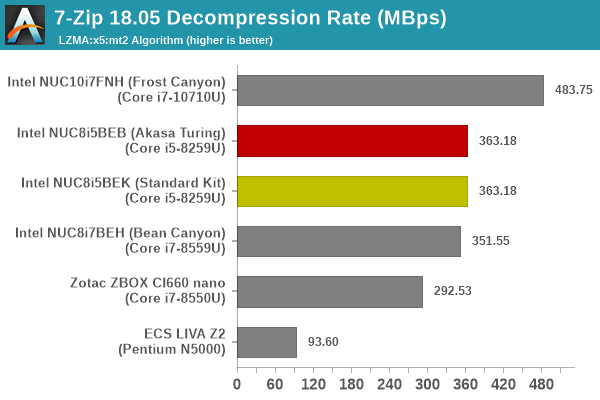
The performance numbers for both benchmarks are close to each other, and within the range of run-to-run variance.
Cryptography Benchmarks
Cryptography has become an indispensable part of our interaction with computing systems. Almost all modern systems have some sort of hardware-acceleration for making cryptographic operations faster and more power efficient. In this sub-section, we look at two different real-world applications that may make use of this acceleration.
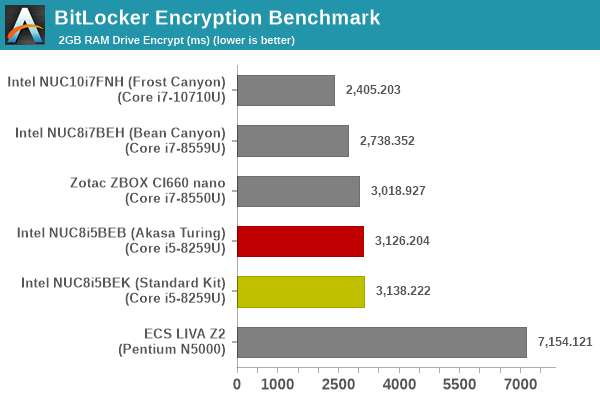
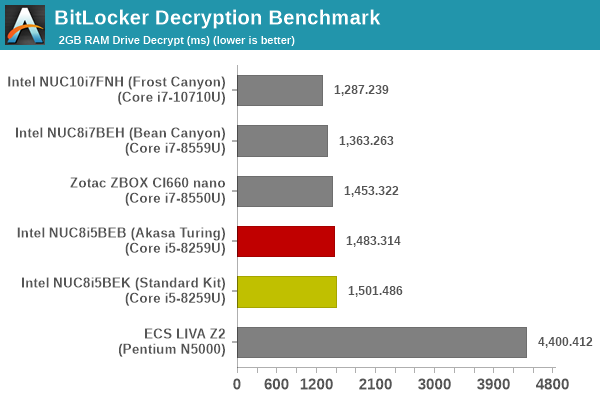
BitLocker is a Windows features that encrypts entire disk volumes. While drives that offer encryption capabilities are dealt with using that feature, most legacy systems and external drives have to use the host system implementation. Windows has no direct benchmark for BitLocker. However, we cooked up a BitLocker operation sequence to determine the adeptness of the system at handling BitLocker operations. We start off with a 2.5GB RAM drive in which a 2GB VHD (virtual hard disk) is created. This VHD is then mounted, and BitLocker is enabled on the volume. Once the BitLocker encryption process gets done, BitLocker is disabled. This triggers a decryption process. The times taken to complete the encryption and decryption are recorded. This process is repeated 25 times, and the average of the last 20 iterations is graphed below.
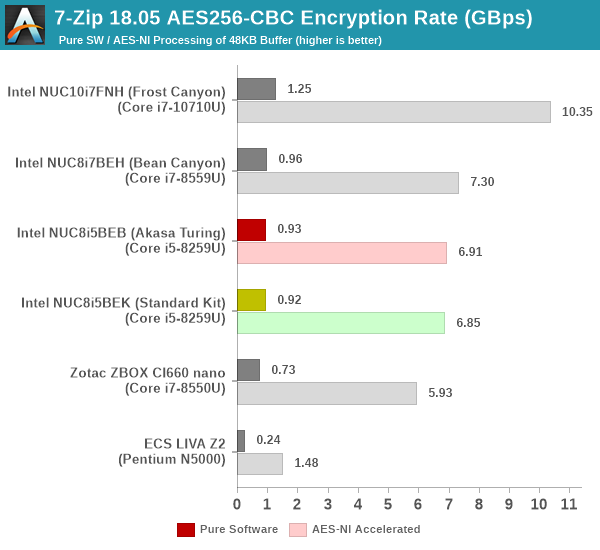
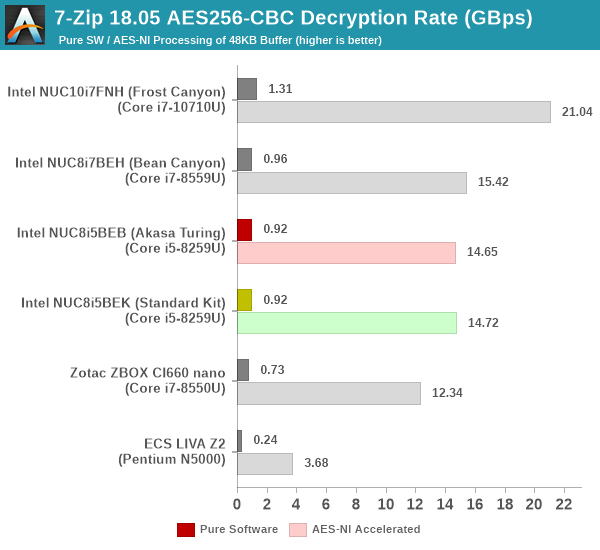
Creation of secure archives is best done through the use of AES-256 as the encryption method while password protecting ZIP files. We re-use the benchmark mode of 7-Zip to determine the AES256-CBC encryption and decryption rates using pure software as well as AES-NI. Note that the 7-Zip benchmark uses a 48KB buffer for this purpose.
Yet another cryptography application is secure network communication. OpenSSL can take advantage of the acceleration provided by the host system to make operations faster. It also has a benchmark mode that can use varying buffer sizes. We recorded the processing rate for a 8KB buffer using the hardware-accelerated AES256-CBC-HAC-SHA1 feature.
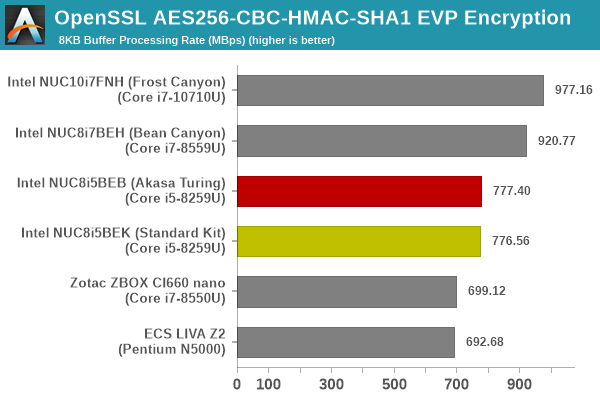
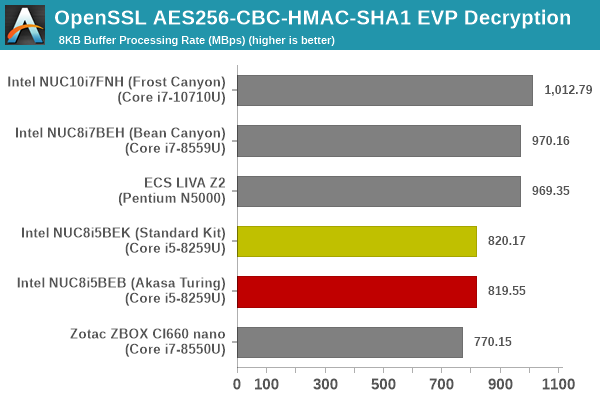
All of the above performance numbers for the standard kit and the Turing version are within the range of run-to-run variance, as expected.
Agisoft Photoscan
Agisoft PhotoScan is a commercial program that converts 2D images into 3D point maps, meshes and textures. The program designers sent us a command line version in order to evaluate the efficiency of various systems that go under our review scanner. The command line version has two benchmark modes, one using the CPU and the other using both the CPU and GPU (via OpenCL). We present the results from our evaluation using the CPU mode only. The benchmark (v1.3) takes 84 photographs and does four stages of computation:
- Stage 1: Align Photographs (capable of OpenCL acceleration)
- Stage 2: Build Point Cloud (capable of OpenCL acceleration)
- Stage 3: Build Mesh
- Stage 4: Build Textures
We record the time taken for each stage. Since various elements of the software are single threaded, and others multithreaded, it is interesting to record the effects of CPU generations, speeds, number of cores, and DRAM parameters using this software.
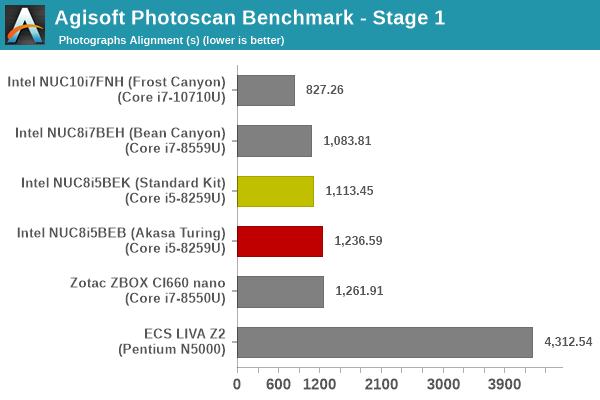
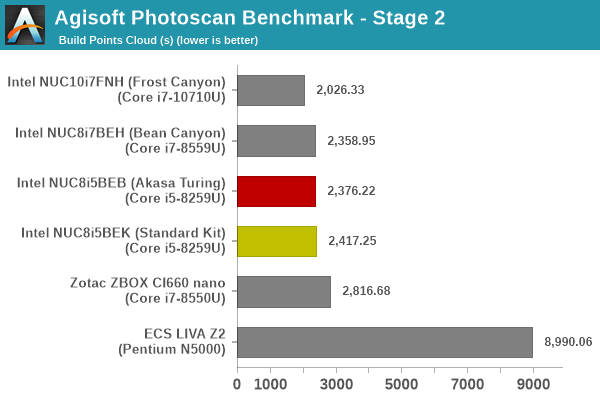
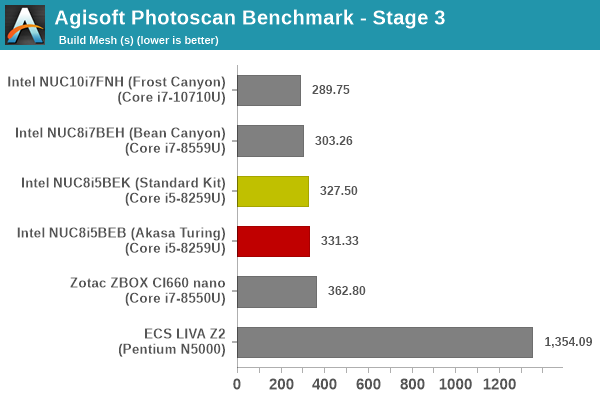
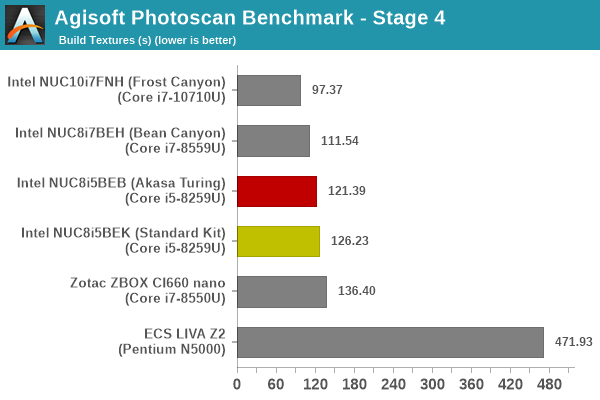
There are variances from stage to stage - however, the overall time taken is similar for both versions.
Dolphin Emulator
Wrapping up our application benchmark numbers is the new Dolphin Emulator (v5) benchmark mode results. This is again a test of the CPU capabilities.
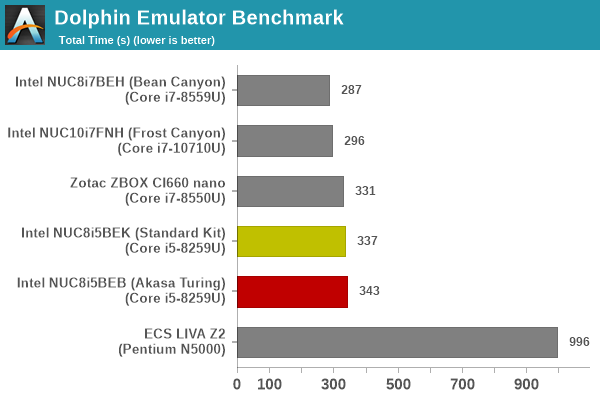
The standard kit completes the benchmark with slightly higher scores, but it is not a significant performance gulf.
The display outputs' characteristics of the Bean Canyon NUC are covered in the review of the NUC8i7BEH. The NUC8i5BEK is similar. We have a HDMI 2.0a port supporting 3840x2160 at 60 Hz with HDCP 2.2 support and HDR. The Thunderbolt 3 / Display Port 1.2 port supports 4096x2160 at 60 Hz with HDCP 2.2 support, but no HDR. HD audio bitstreaming is supported on both outputs.
Our evaluation of the Turing build as a HTPC was done using the native HDMI output connected to a TCL 55P607 4K HDR TV via a Denon AVR-X3400H AV receiver. We tested out various display refresh rates ranging from 23.976 Hz to 59.94 Hz. Of particular interest is the 23.976 Hz (23p) setting, which Intel used to have trouble with in the pre-Broadwell days. The accuracy obtained in the Turing build is actually better than that of the NUC8i7BEH reviewed earlier.

The gallery below presents screenshots from the other refresh rates that were tested. The system has no trouble maintaining a fairly accurate refresh rate throughout the duration of the video playback.


Similar to the NUC8i7BEH, the Turing build based on the NUC8i5BEK also satisfies all the requirements such as SGX and appropriate Management Engine firmware to enable playback of Ultra HD Blu-rays.
YouTube and Netflix Streaming
Our HTPC testing with respect to YouTube had been restricted to playback of a 1080p music video using the native HTML5 player in Firefox. The move to 4K, and the need to evaluate HDR support have made us choose Mystery Box's Peru 8K HDR 60FPS video as our test sample moving forward. On PCs running Windows, it is recommended that HDR streaming videos be viewed using the Microsoft Edge browser after putting the desktop in HDR mode.
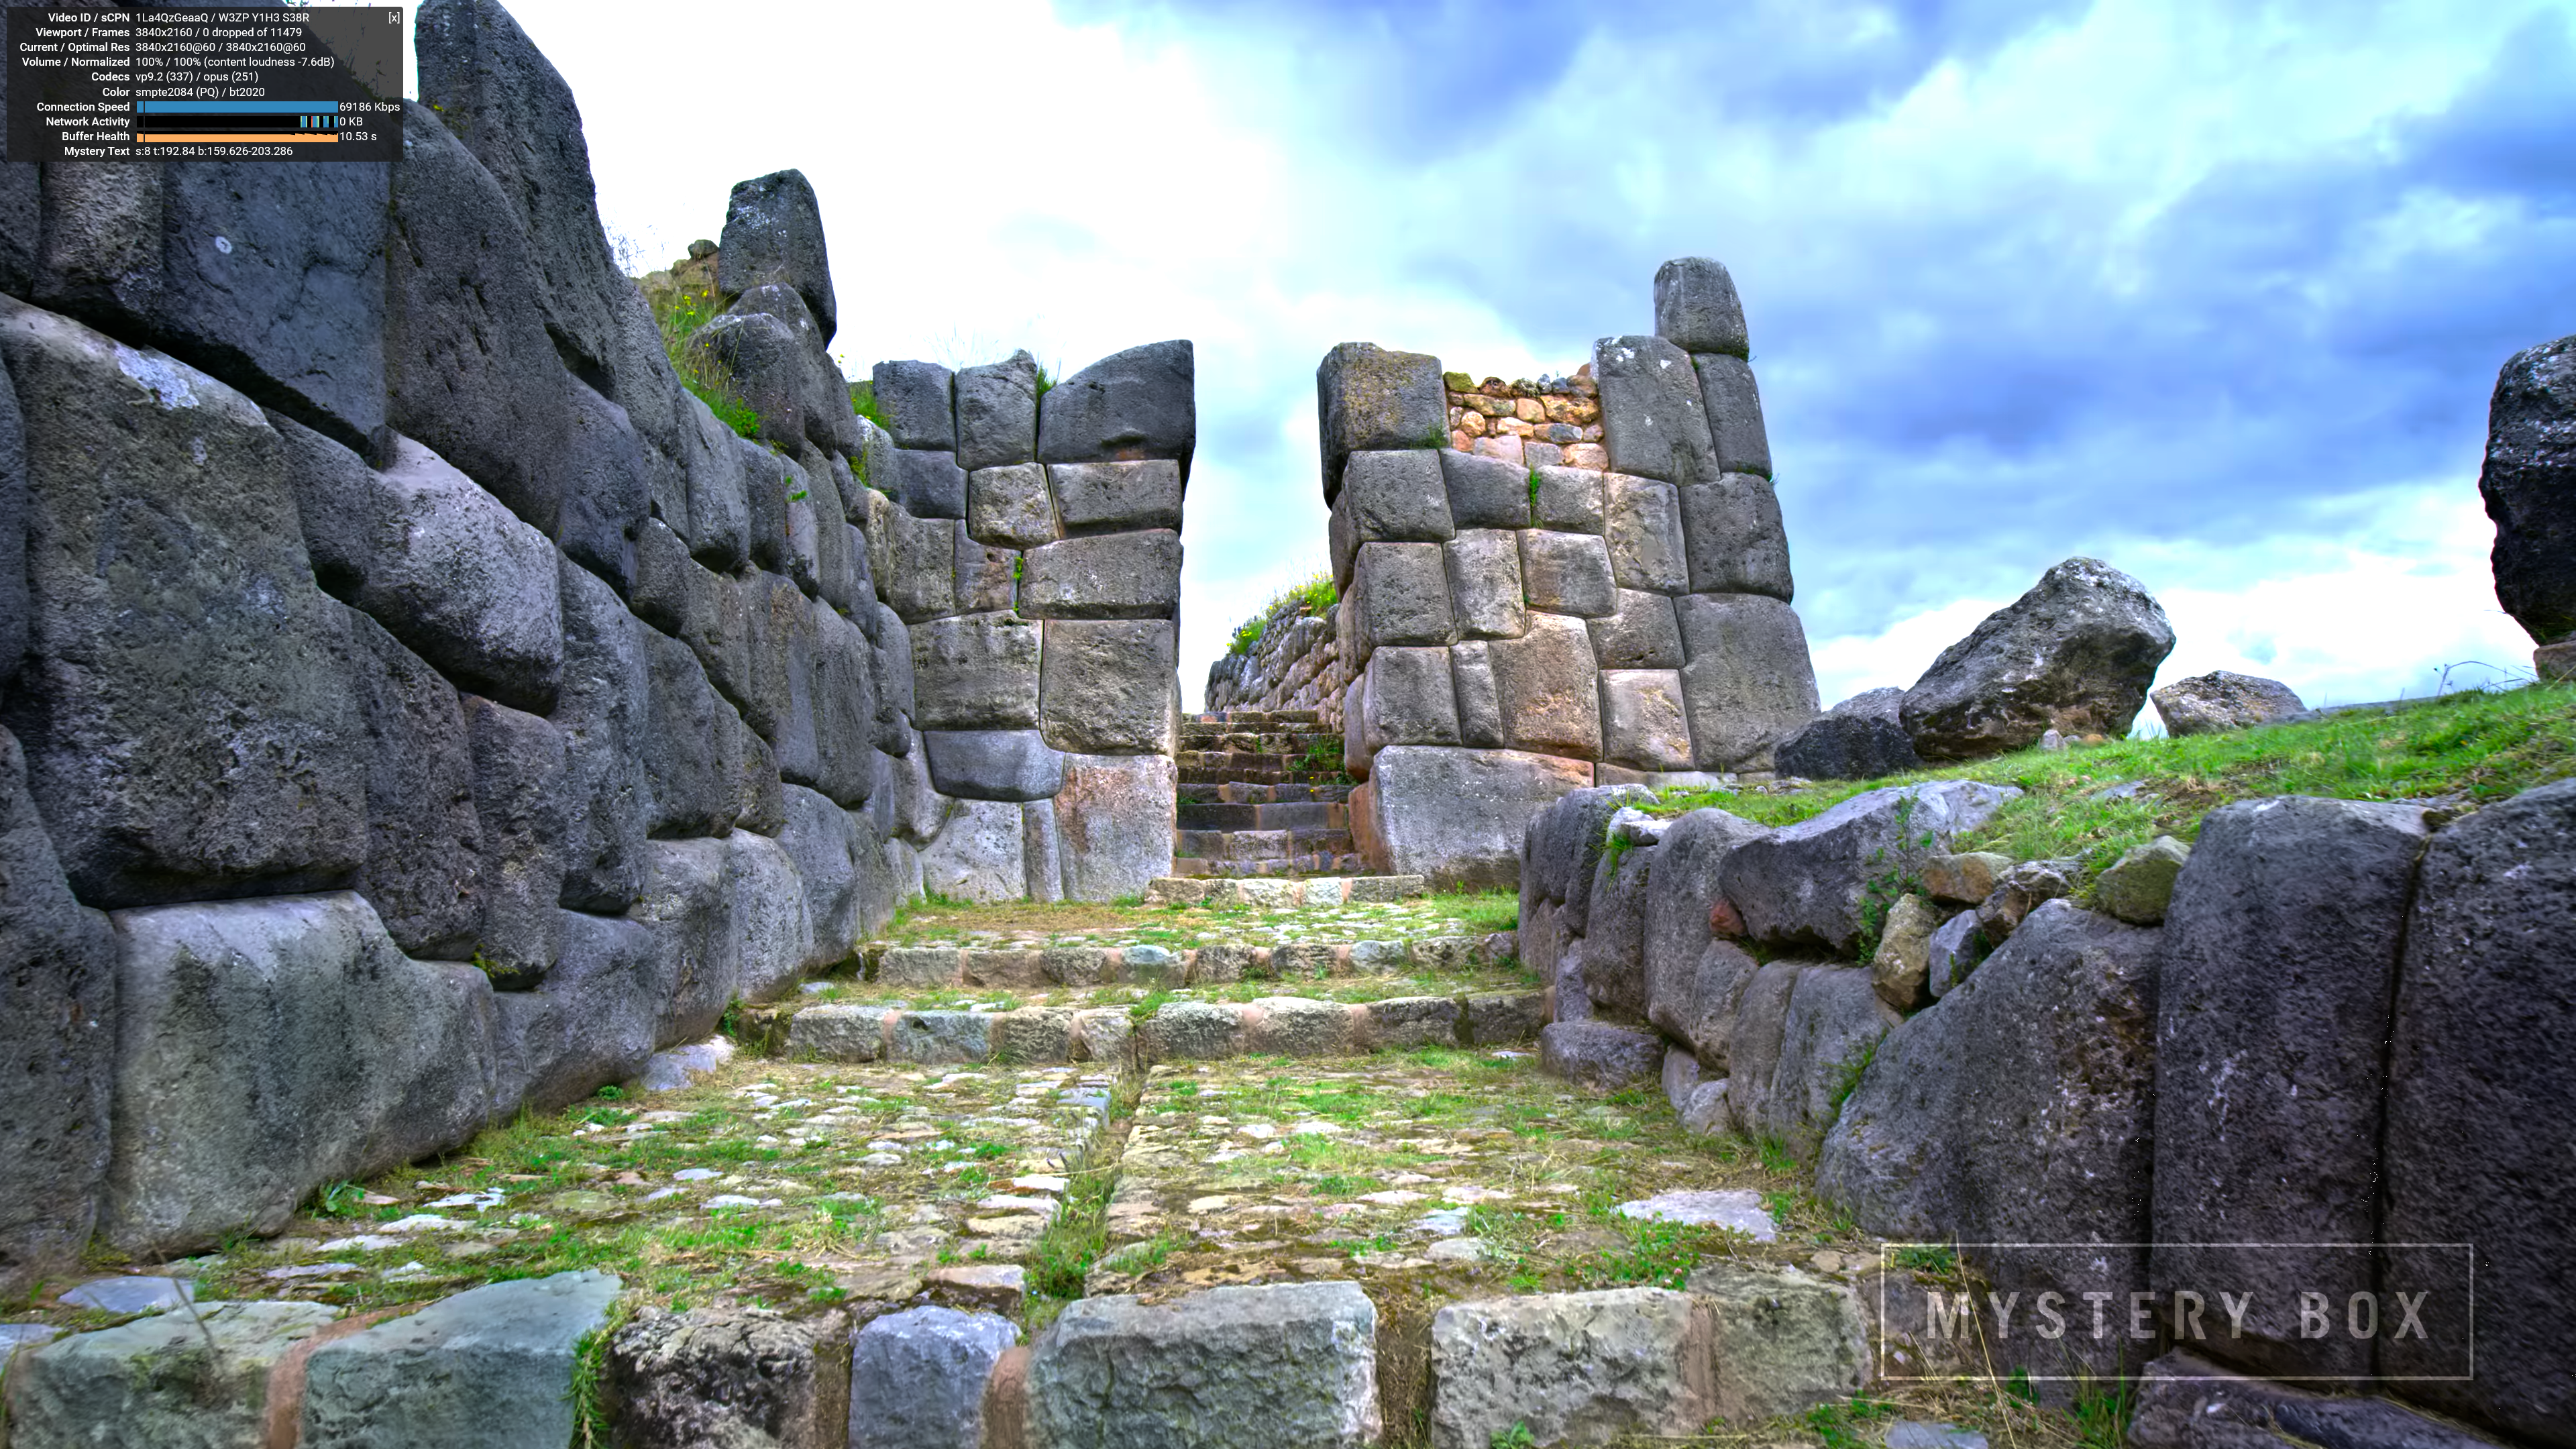
The Iris Plus Graphics 655 GPU supports VP9 Profile 2 decoding, and YouTube is able to successfully deliver the 4Kp60 VP9.2 stream to the MS Edge browser.
Various metrics of interest such as GPU usage and at-wall power consumption were recorded for the first four minutes of the playback of the above video. The numbers are graphed below.
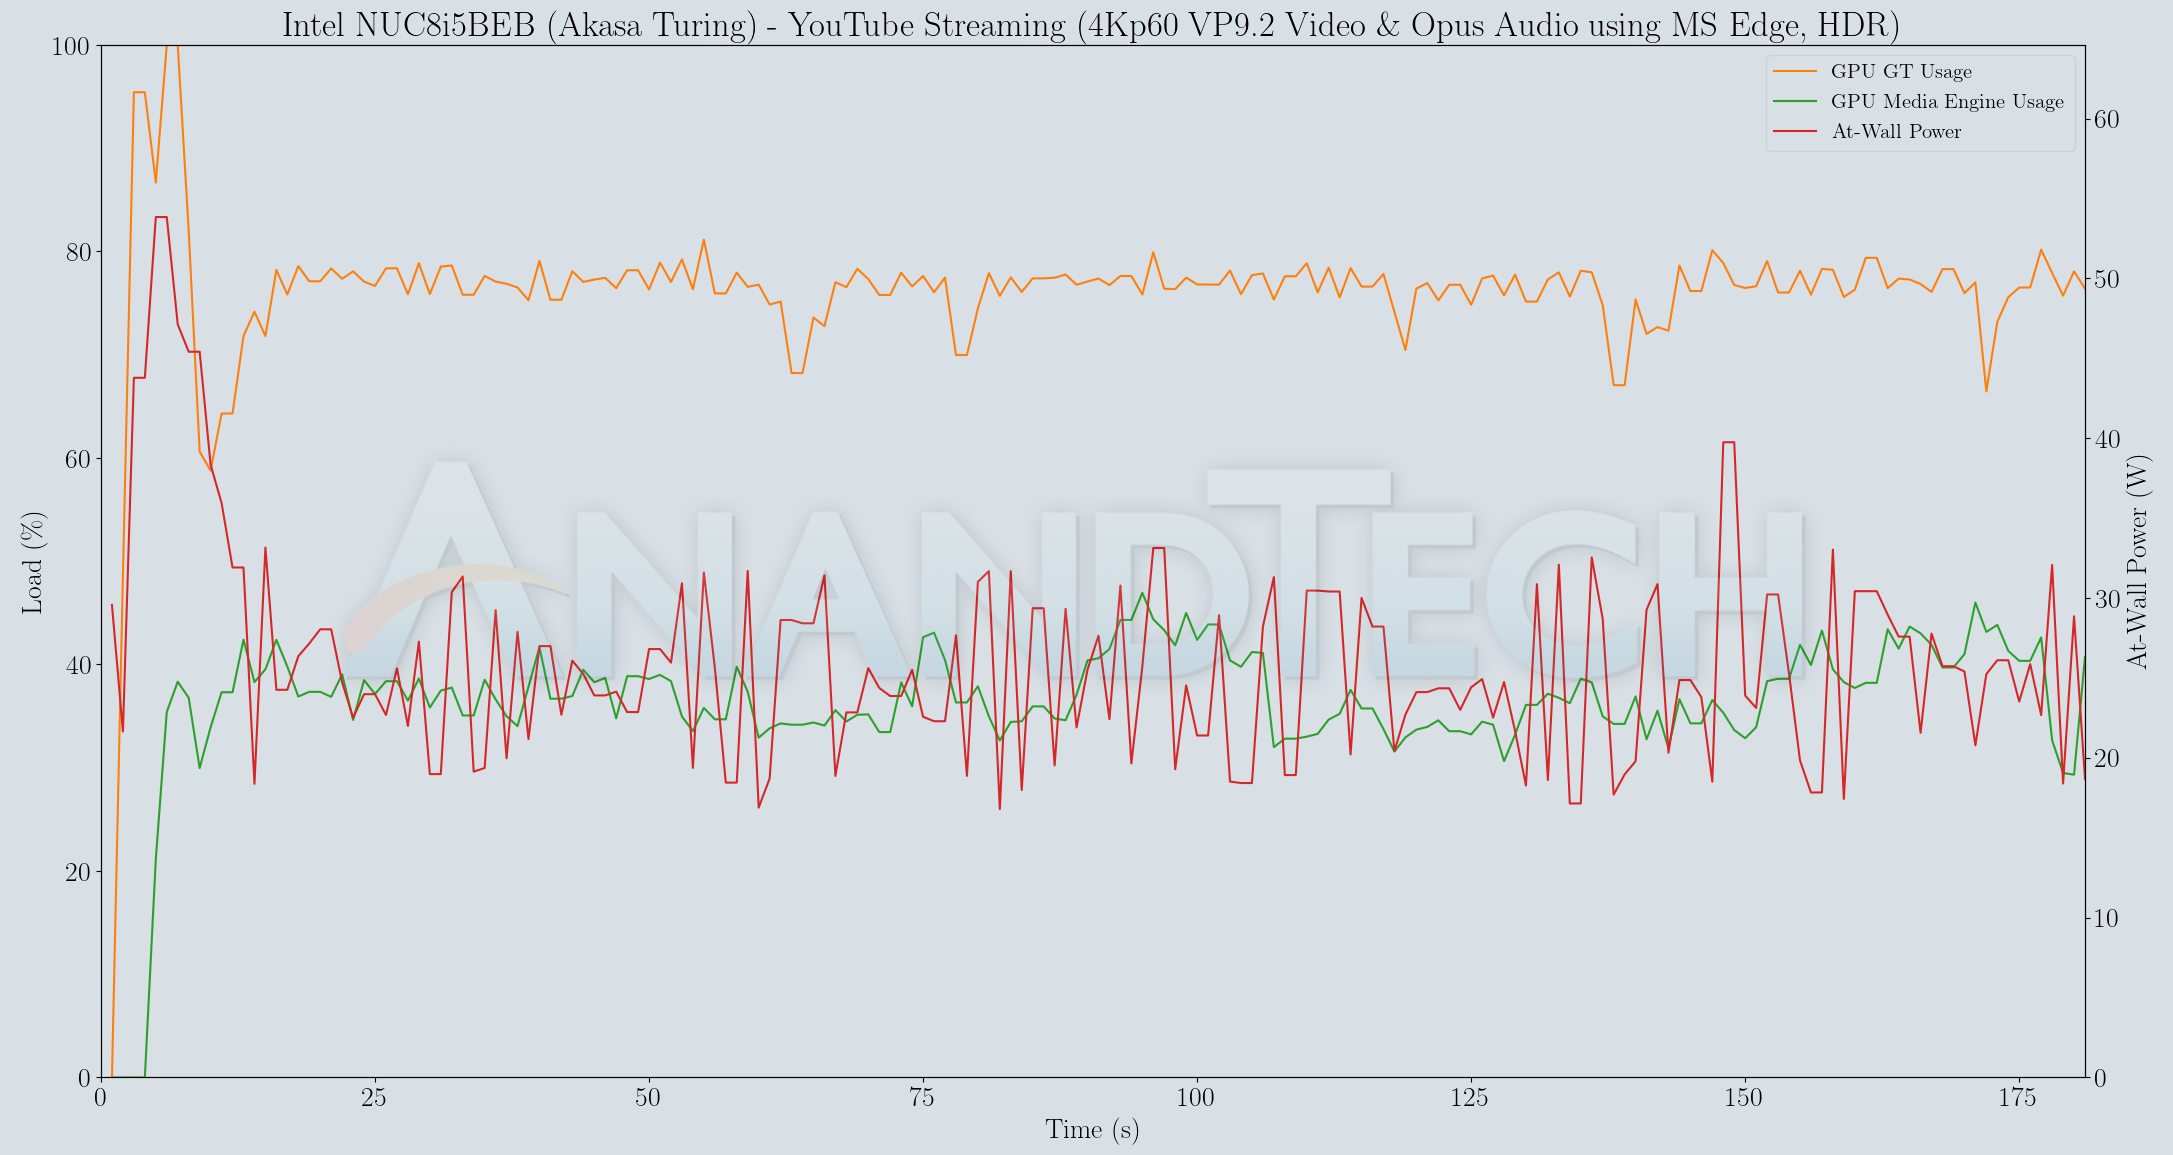
The at-wall power consumption is around 30W for the YouTube streaming case, and the media engine usage is around 40%. The GPU loading is around 75% (which also seems to be accounting the 40% media engine usage).
The Netflix 4K HDR capability works with native Windows Store app as well as the Microsoft Edge browser. We used the Windows Store app to evaluate the playback of Season 4 Episode 4 of the Netflix Test Patterns title. The OS screenshot facilities obviously can't capture the video being played back. However, the debug OSD (reachable by Ctrl-Alt-Shift-D) can be recorded.
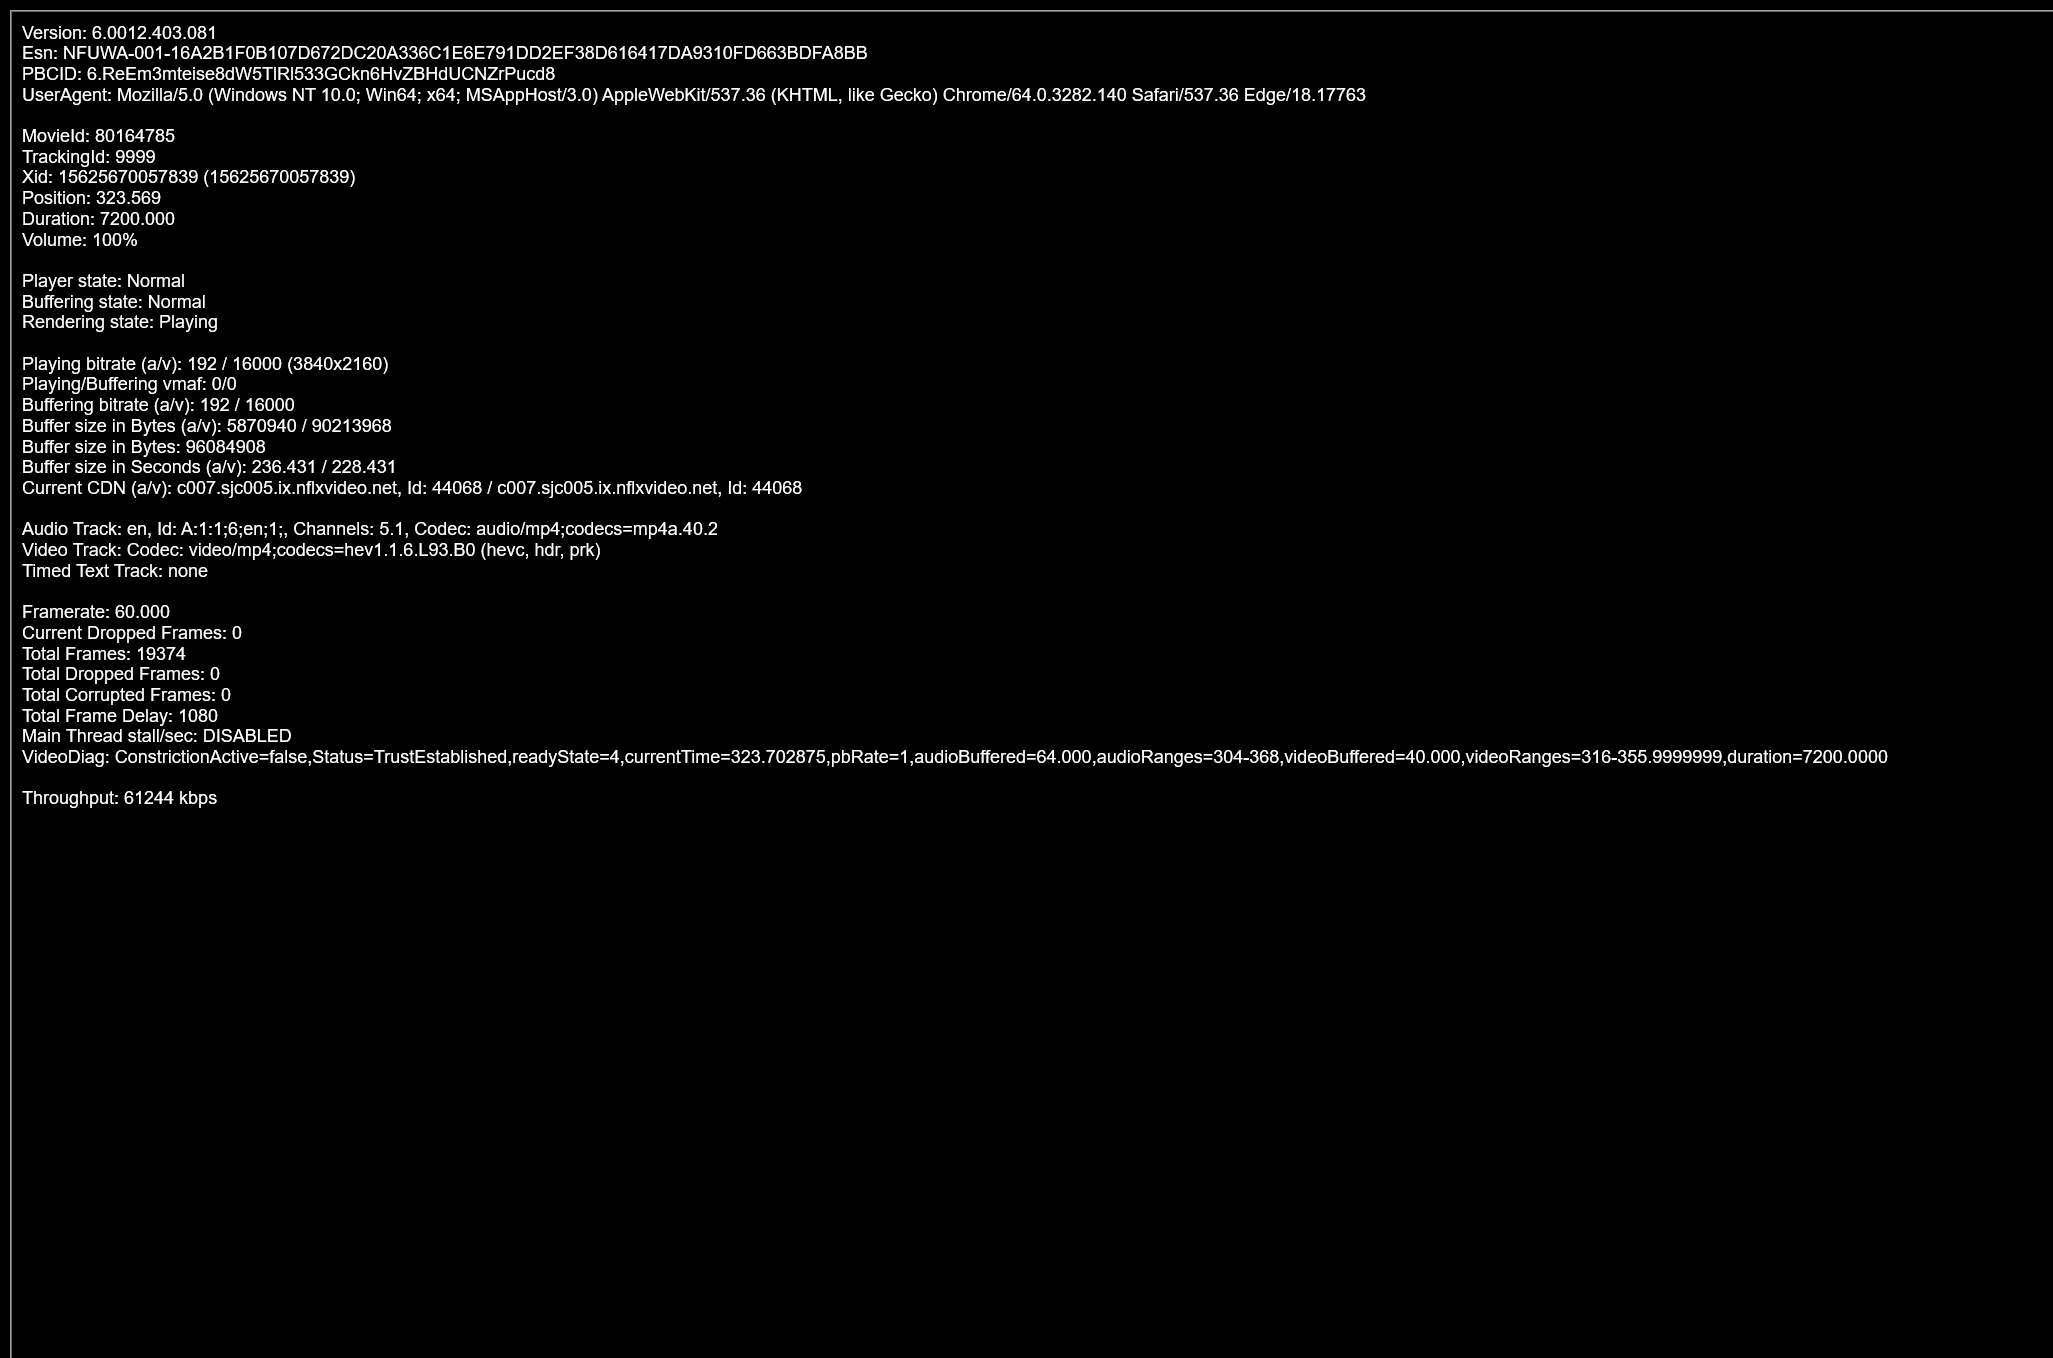
The (hevc,hdr,prk) entry corresponding to the Video Track in the debug OSD, along with the A/V bitrate details (192 kbps / 16 Mbps) indicate that the HDR stream is indeed being played back. Similar to the YouTube streaming case, metrics such as GPU usage and at-wall power consumption were recorded for the first three minutes of the playback of the title. The numbers are graphed below.
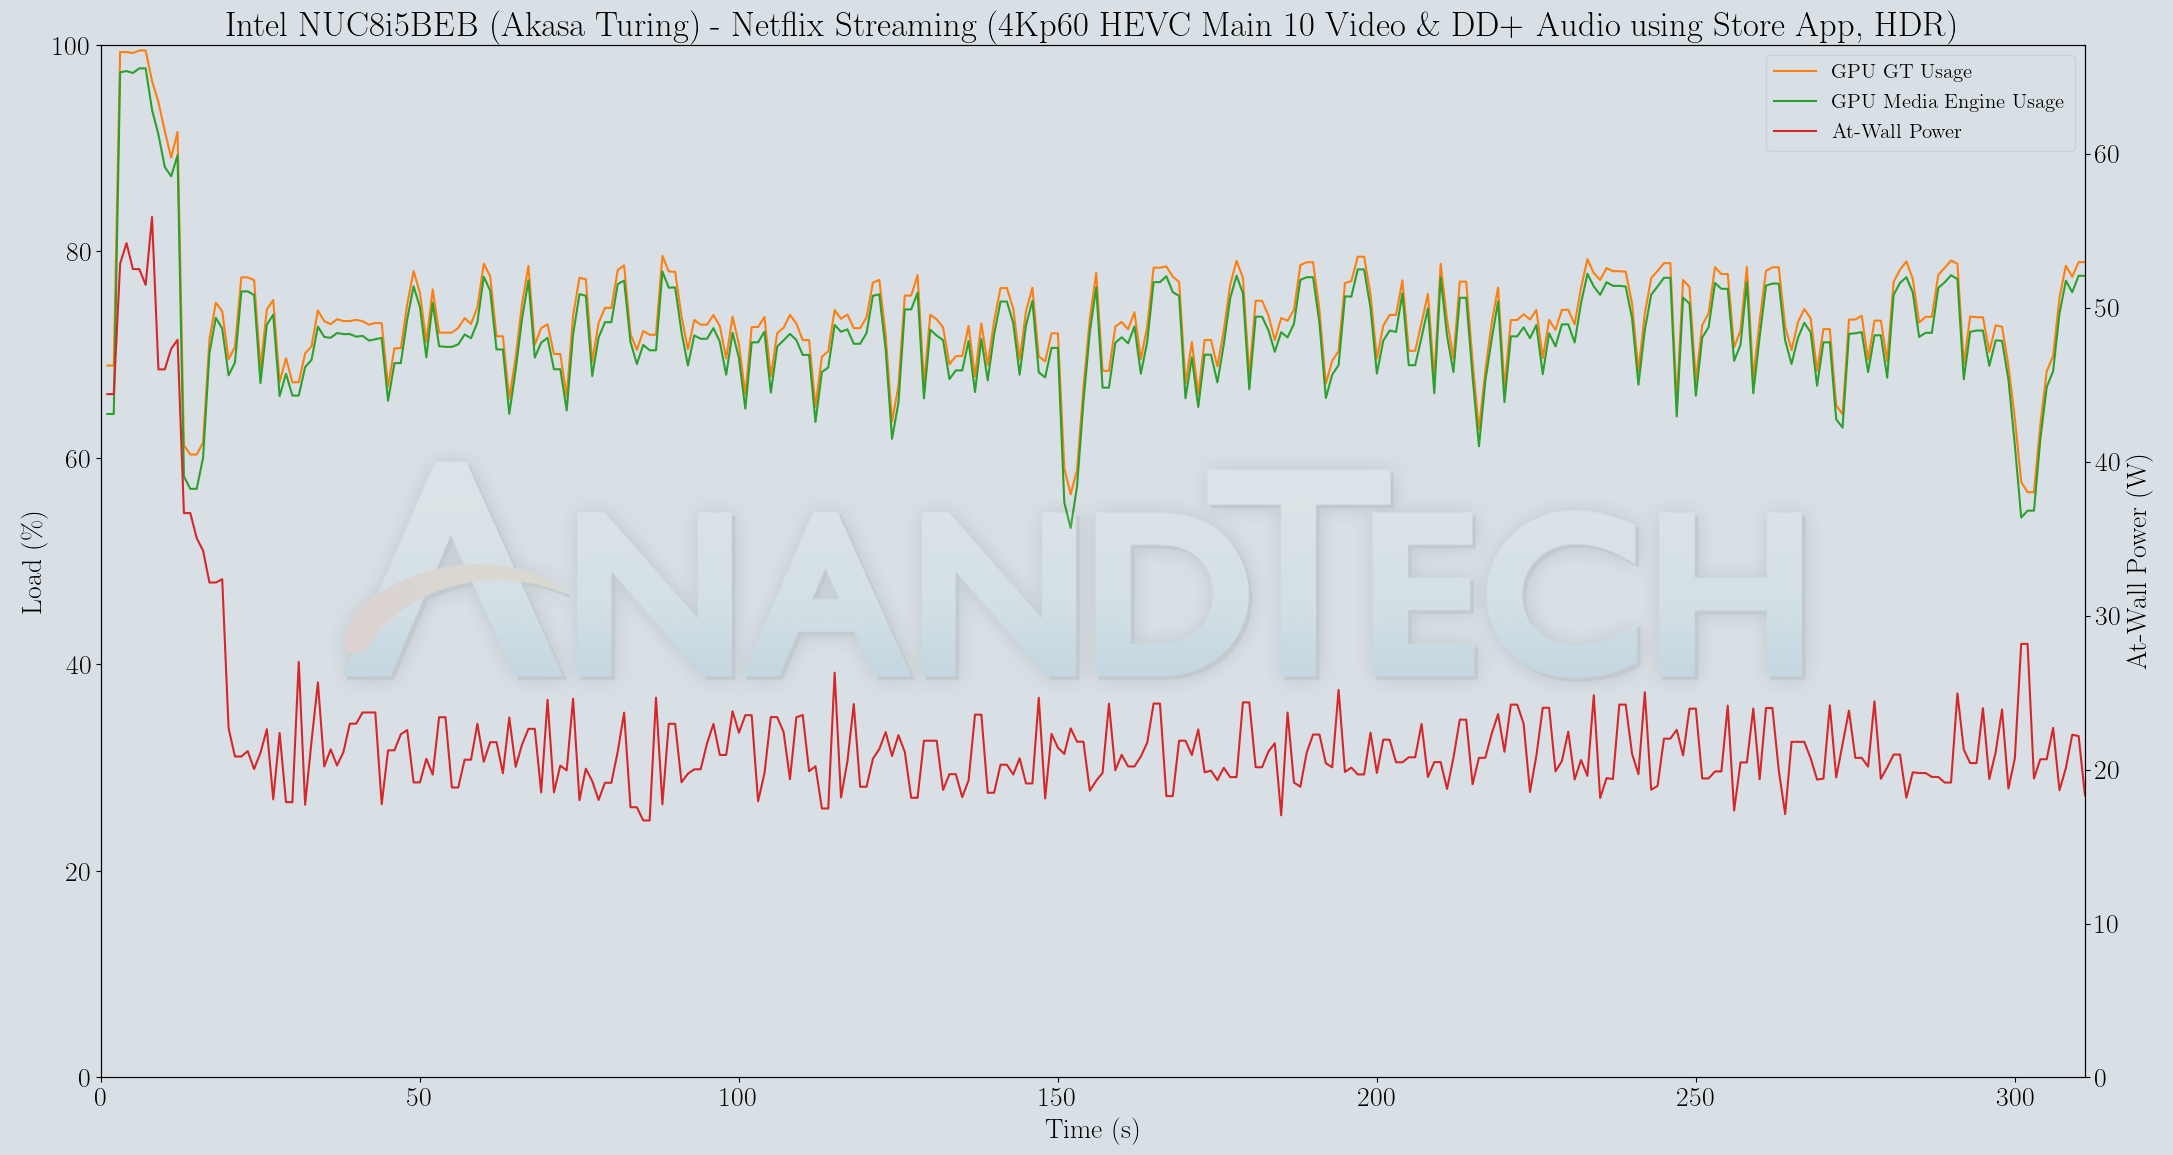
The 4Kp60 HEVC Main 10 decode takes up north of 70% of the media engine. The at-wall power consumption is slightly north of 20W.
Local Media Playback and Video Processing
Evaluation of local media playback and video processing is done by playing back files encompassing a range of relevant codecs, containers, resolutions, and frame rates. A note of the efficiency is also made by tracking GPU usage and power consumption of the system at the wall. Users have their own preference for the playback software / decoder / renderer, and our aim is to have numbers representative of commonly encountered scenarios. Towards this, we played back the test streams using the following combinations:
- MPC-HC x64 1.8.5 + LAV Video Decoder (DXVA2 Native) + Enhanced Video Renderer - Custom Presenter (EVR-CP)
- MPC-HC x64 1.8.5 + LAV Video Decoder (D3D11) + madVR 0.92.17 (DXVA-Focused)
- MPC-HC x64 1.8.5 + LAV Video Decoder (D3D11) + madVR 0.92.17 (Lanczos-Focused)
- VLC 3.0.8
- Kodi 18.6
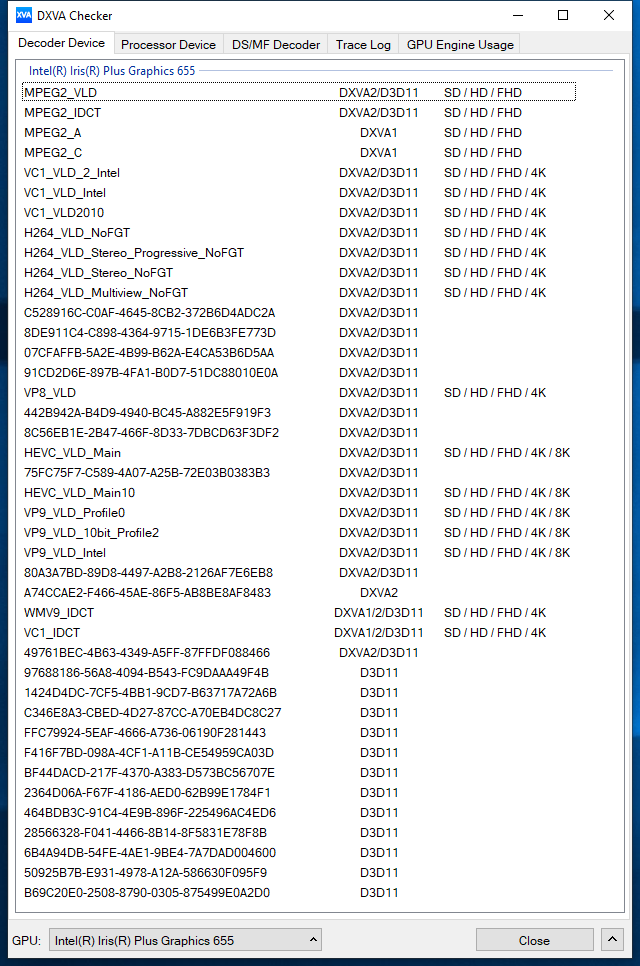
The thirteen test streams (each of 90s duration) were played back from the local disk with an interval of 30 seconds in-between. Various metrics including GPU usage and at-wall power consumption were recorded during the course of this playback. Prior to looking at the metrics, it must be mentioned that the DXVA Checker report for the NUC8i5BEK is the same as the one for the NUC8i7BEH.
All our playback tests were done with the desktop HDR setting turned on. It is possible for certain system configurations to have madVR automatically turn on/off the HDR capabilities prior to the playback of a HDR video, but, we didn't take advantage of that in our testing.
VLC and Kodi
VLC is the playback software of choice for the average PC user who doesn't need a ten-foot UI. Its install-and-play simplicity has made it extremely popular. Over the years, the software has gained the ability to take advantage of various hardware acceleration options. Kodi, on the other hand, has a ten-foot UI making it the perfect open-source software for dedicated HTPCs. Support for add-ons make it very extensible and capable of customization. We played back our test files using the default VLC and Kodi configurations, and recorded the following metrics.
| Video Playback Efficiency - VLC and Kodi | |||
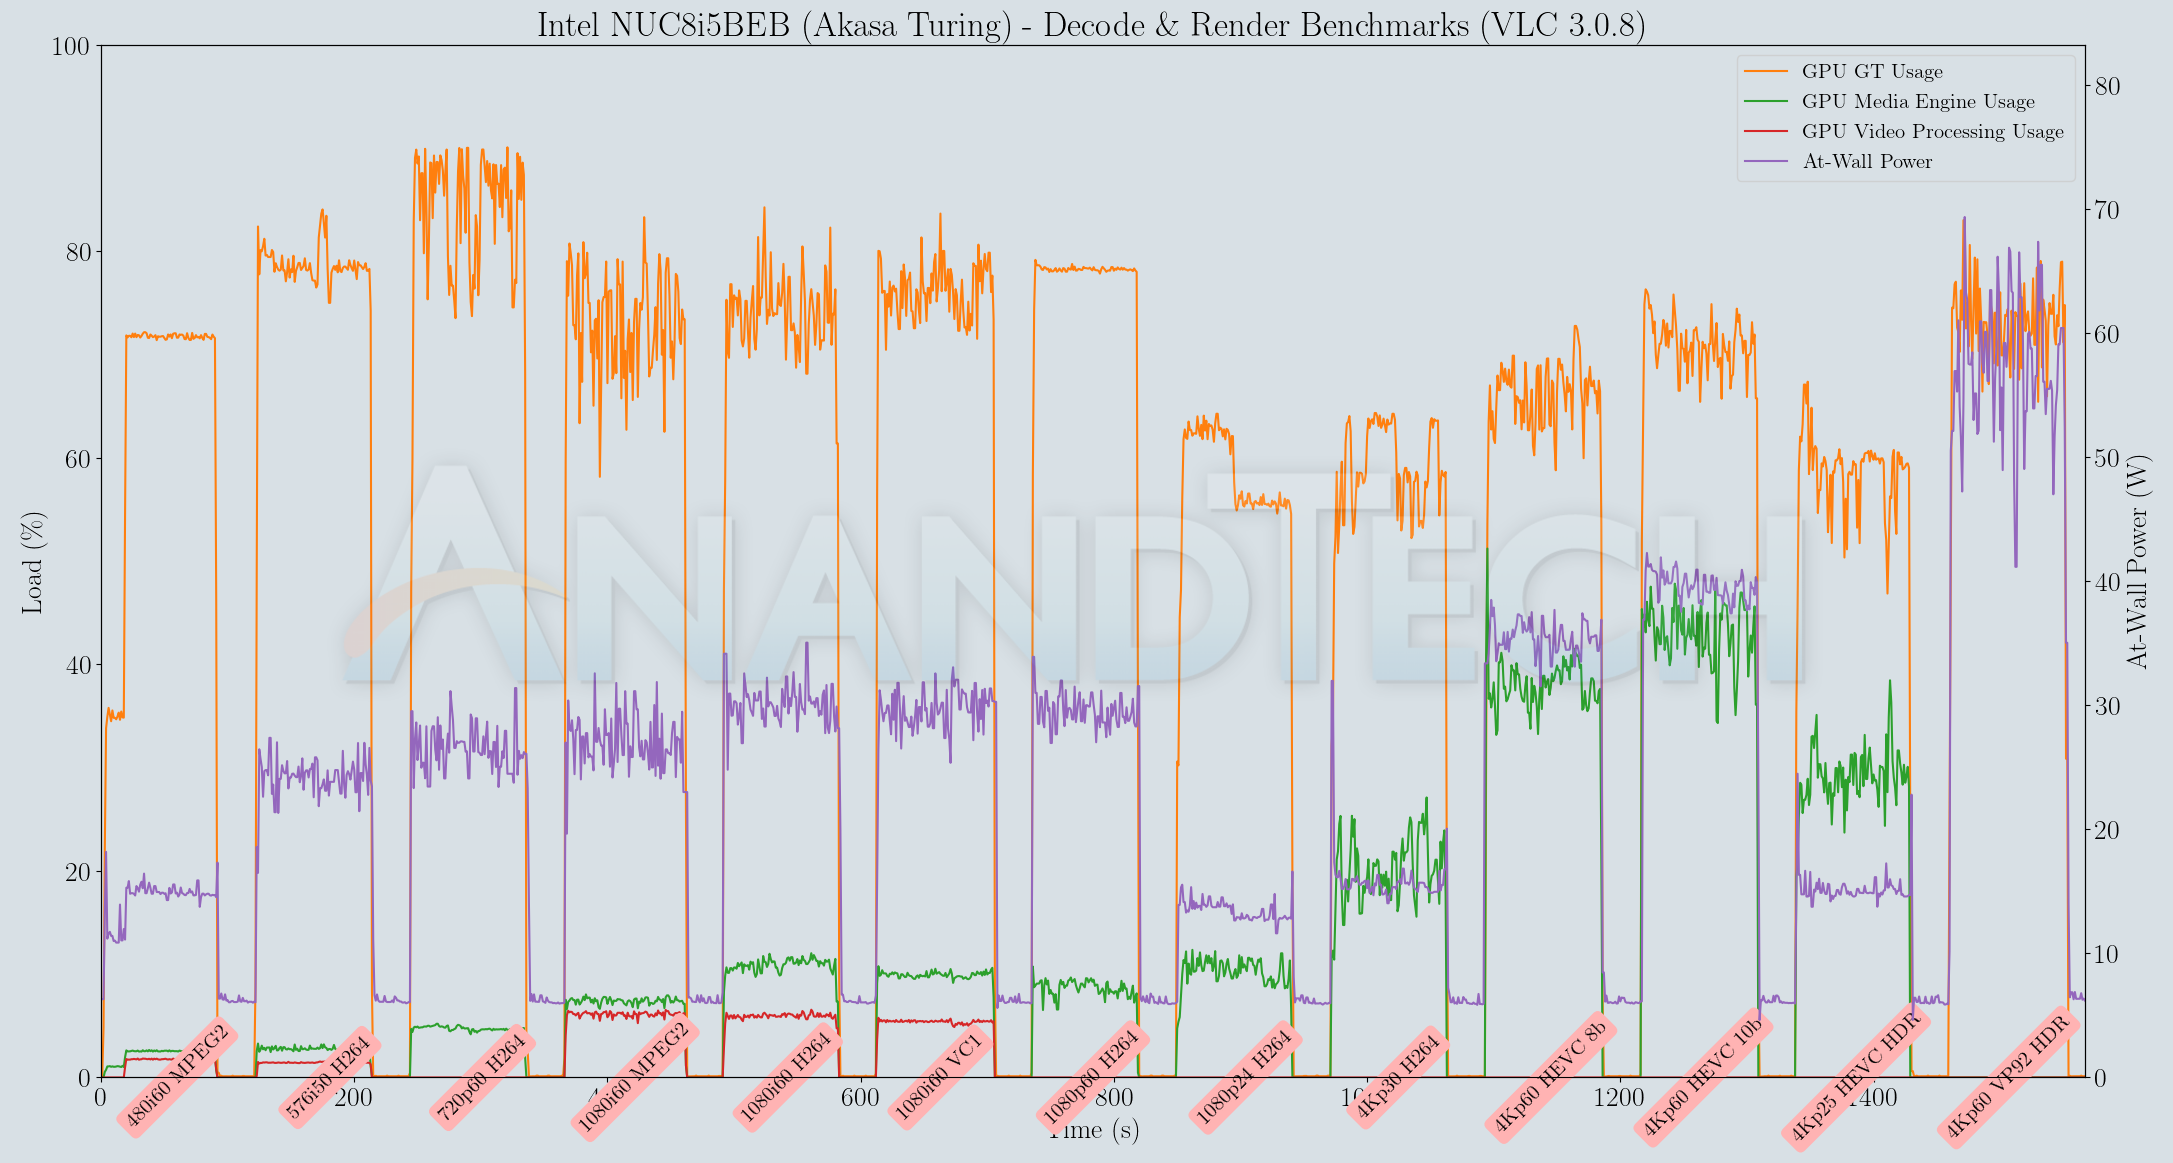
VLC doesn't utilize hardware acceleration for the VP9 Profile 2 stream, but does for everything else. Kodi uses hardware acceleration for all of the test cases. The at-wall power consumption is south of 25W for all streams with Kodi, but goes as high as 40W in VLC despite hardware decoding. On the whole, Kodi is more efficient compared to VLC for media playback on the NUC8i5BEB (Akasa Turing).
MPC-HC
MPC-HC offers an easy way to test out different combinations of decoders and renderers. The first configuration we evaluated is the default post-install scenario, with only the in-built LAV Video Decoder forced to DXVA2 Native mode. Two additional passes were done with different madVR configurations. In the first one (DXVA-focused), we configured madVR to make use of the DXVA-accelerated video processing capabilities as much as possible. In the second (Lanczos-focused), the image scaling algorithms were set to 'Lanczos 3-tap, with anti-ringing checked'. Chroma upscaling was configured to be 'BiCubic 75 with anti-ringing checked' in both cases. The metrics collected during the playback of the test files using the above three configurations are presented below.
| Video Playback Efficiency - MPC-HC with EVR-CP and madVR | |||
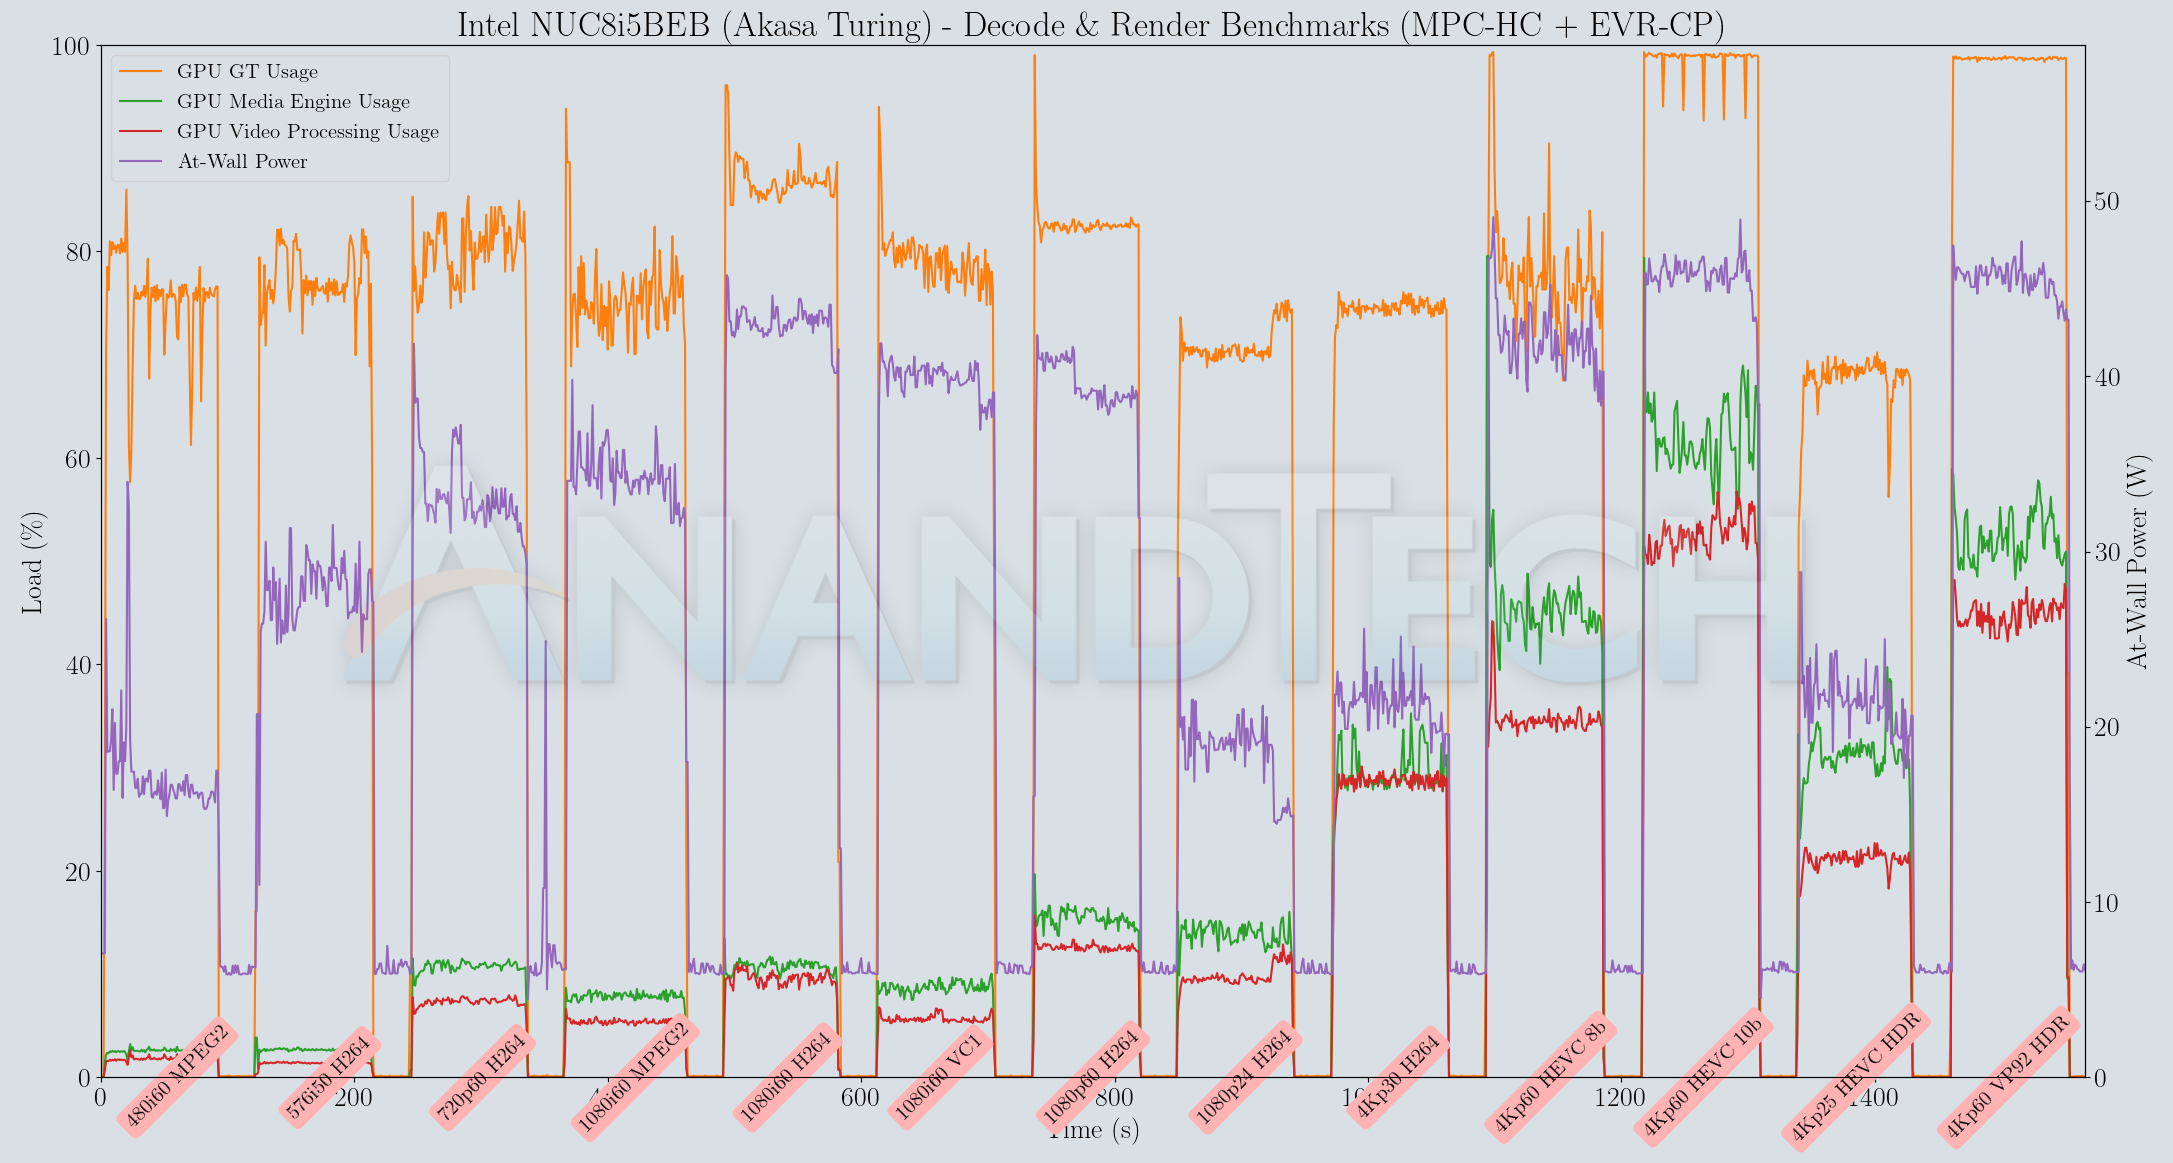
The passively-cooled Bean Canyon NUC is good enough to be able to play back the streams in EVR-CP configuration without any issues, but the power consumption numbers are similar to VLC's. With madVR, the GPU usage goes above 90% for some of the streams, resulting in dropped frames. Overall, Kodi remains the best choice for a playback program to use with the Bean Canyon NUC.
The power consumption at the wall was measured with a 4K display being driven through the HDMI port. In the graphs below, we compare the idle and load power of the Intel NUC8i5BEK (Standard Kit) and the NUC8i5BEB (Akasa Turing) with other low power PCs evaluated before. For load power consumption, we ran the AIDA64 System Stability Test with various stress components, and noted the maximum sustained power consumption at the wall.
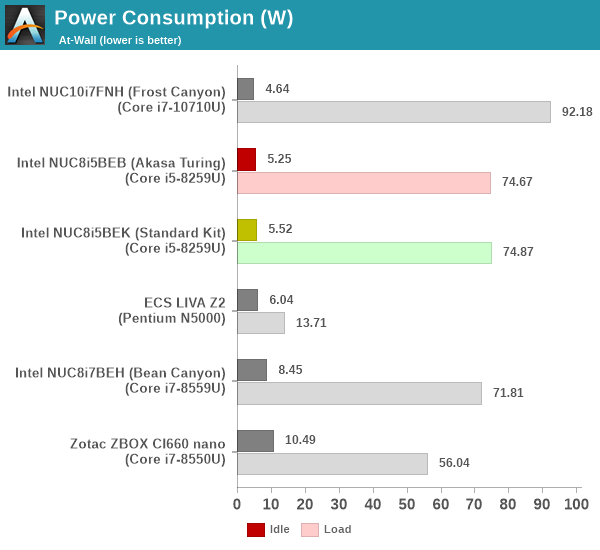
As expected, the peak and idle power consumption numbers for both configurations are in the same ballpark. The minor drop for the Turing configuration can be attributed to the absence of the cooling fan.
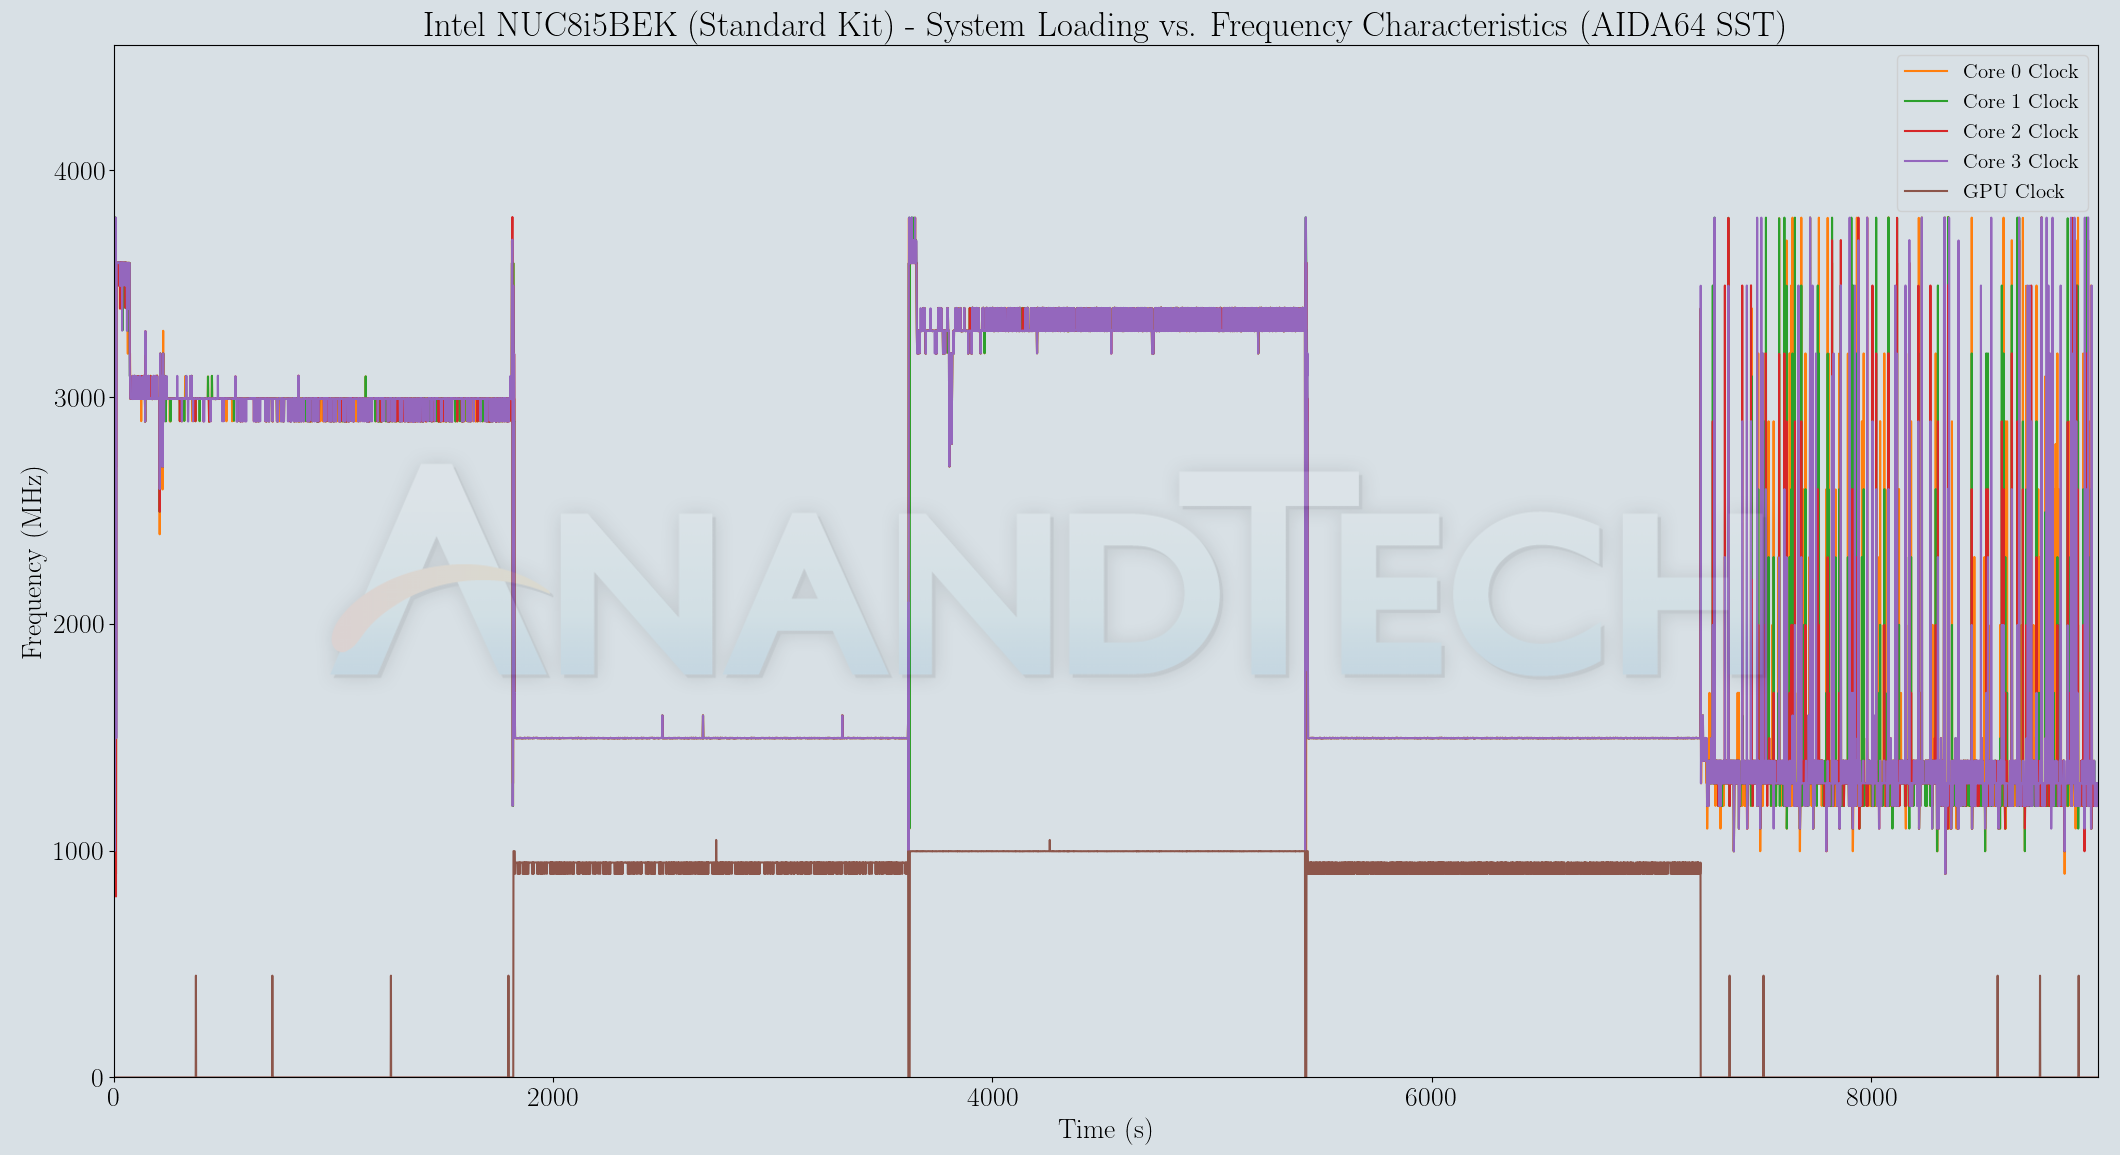
Our thermal stress routine starts with the system at idle, followed by four stages of different system loading profiles using the AIDA64 System Stability Test (each of 30 minutes duration). In the first stage, we stress the CPU, caches and RAM. In the second stage, we add the GPU to the above list. In the third stage, we stress the GPU standalone. In the final stage, we stress all the system components (including the disks). Beyond this, we leave the unit idle in order to determine how quickly the various temperatures in the system can come back to normal idling range. The various clocks, temperatures and power consumption numbers for the system during the above routine are presented in the graphs below. The interesting comparison here is between the behavior of the standard kit and the Turing configuration.
| Intel NUC8i5BEK (Standard Kit) System Loading with the AIDA64 System Stability Test | |||
| Intel NUC8i5BEB (Akasa Turing) System Loading with the AIDA64 System Stability Test | |||
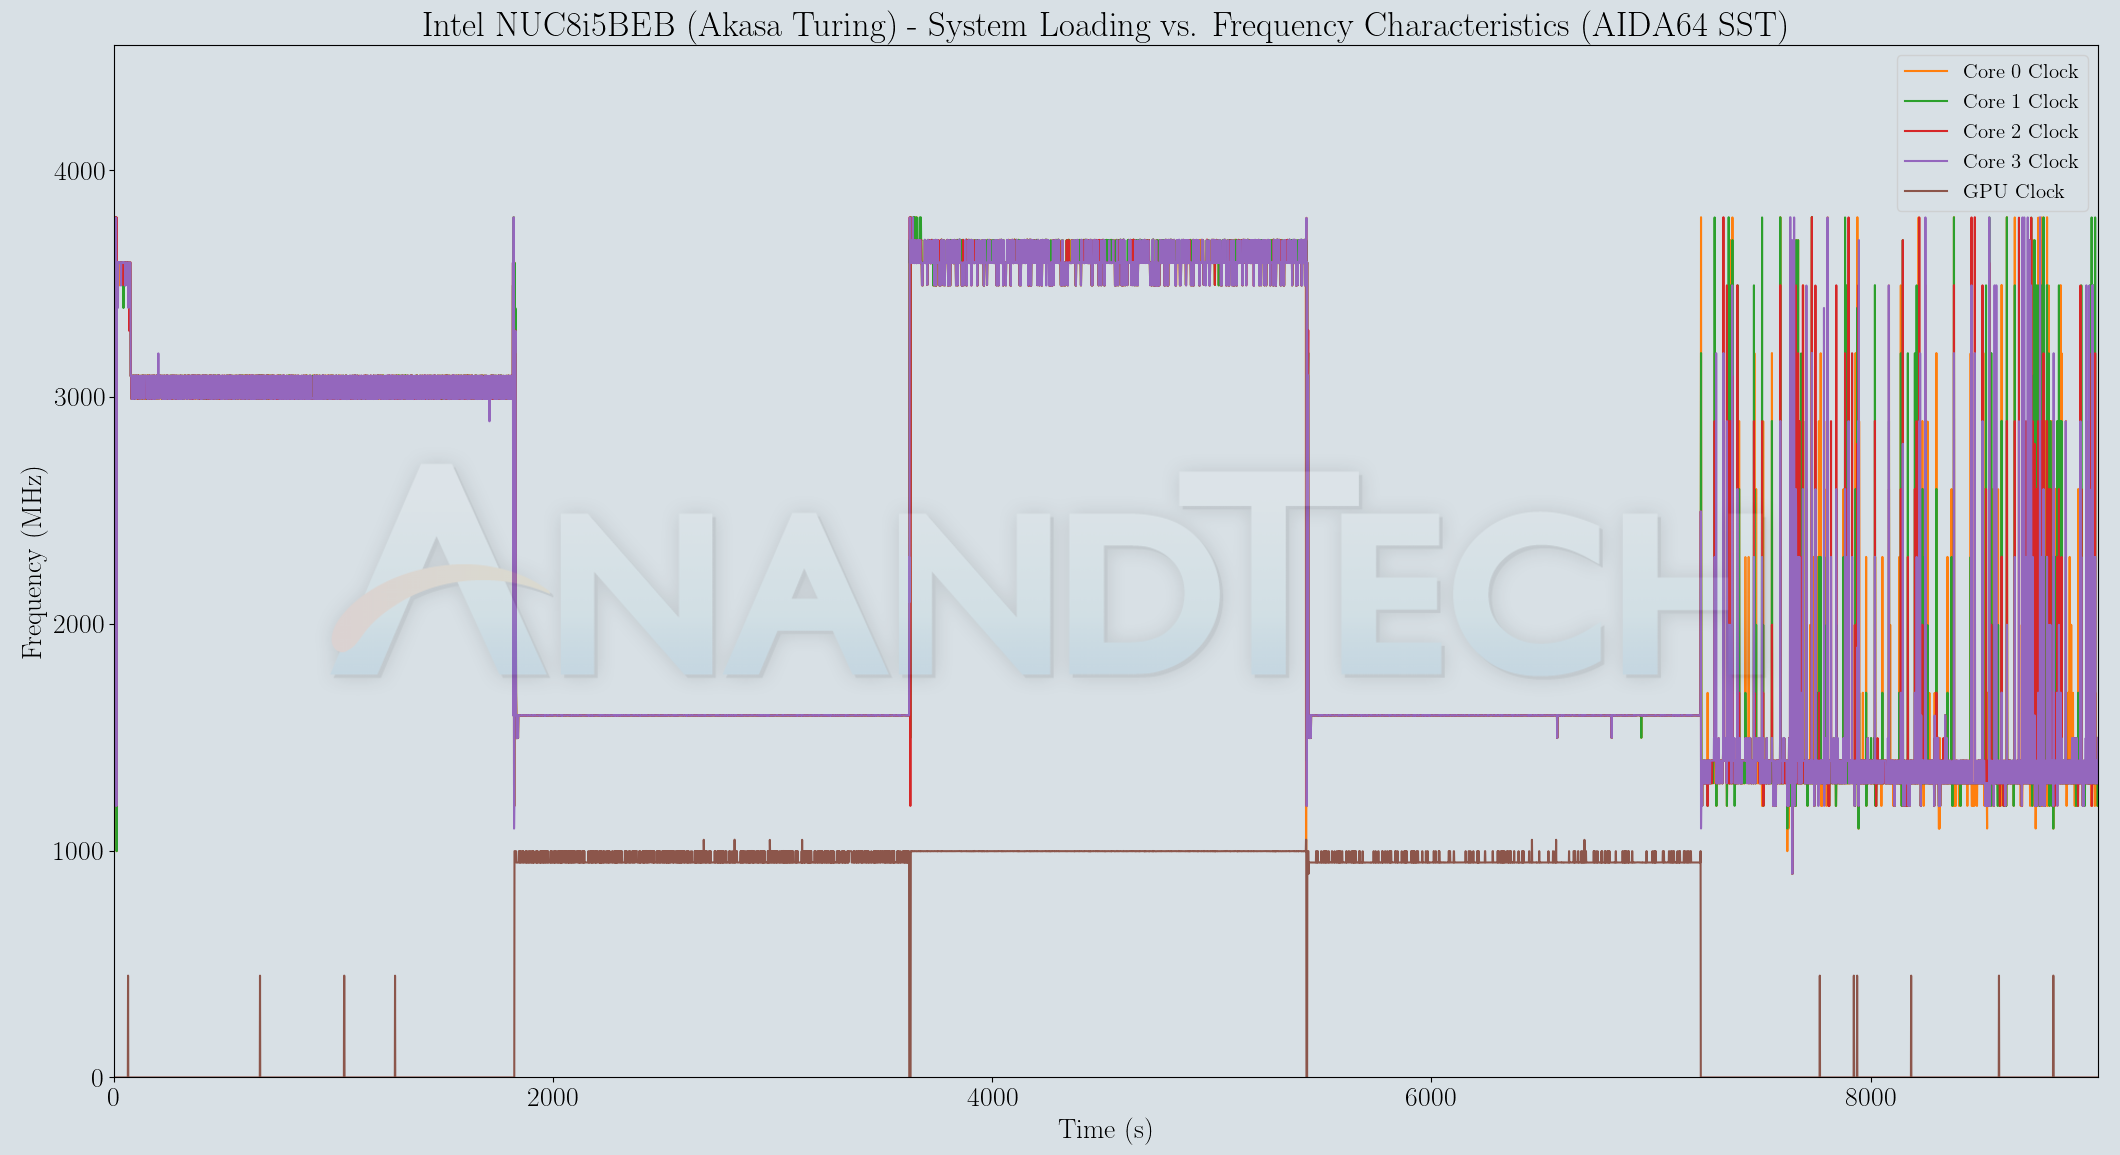
The Turing configuration is able to maintain slightly higher core clock frequencies during the actual workloads compared to the actively cooled kit. The temperatures present a clear reason - while the actively cooled version settles down around 90C during the first phase, it is around 80C for the Turing configuration. The drawback for the Turing build is with the disk stress - the presence of a thermal pad on top of the M.2 SSD in the standard kit enables the SSD temperature to stay well south of 60C. However, the Turing configuration lets the SSD go up to 80C (at which point the SSD probably starts throttling). The other aspect to note is the rate of drop in temperature after the load is removed - the actively cooled configuration goes below 40C quite quickly. In the same duration, the fanless version is still above 40C despite not reaching as high a temperature as the actively cooled configuration. The power numbers show that the package power with this particular BIOS configuration is capped at 30W outside the boost zone. We do see the actively cooled version stay in the boost zone longer than the fanless version - which probably explains why many of the benchmarks showed the standard kit with a slight edge.
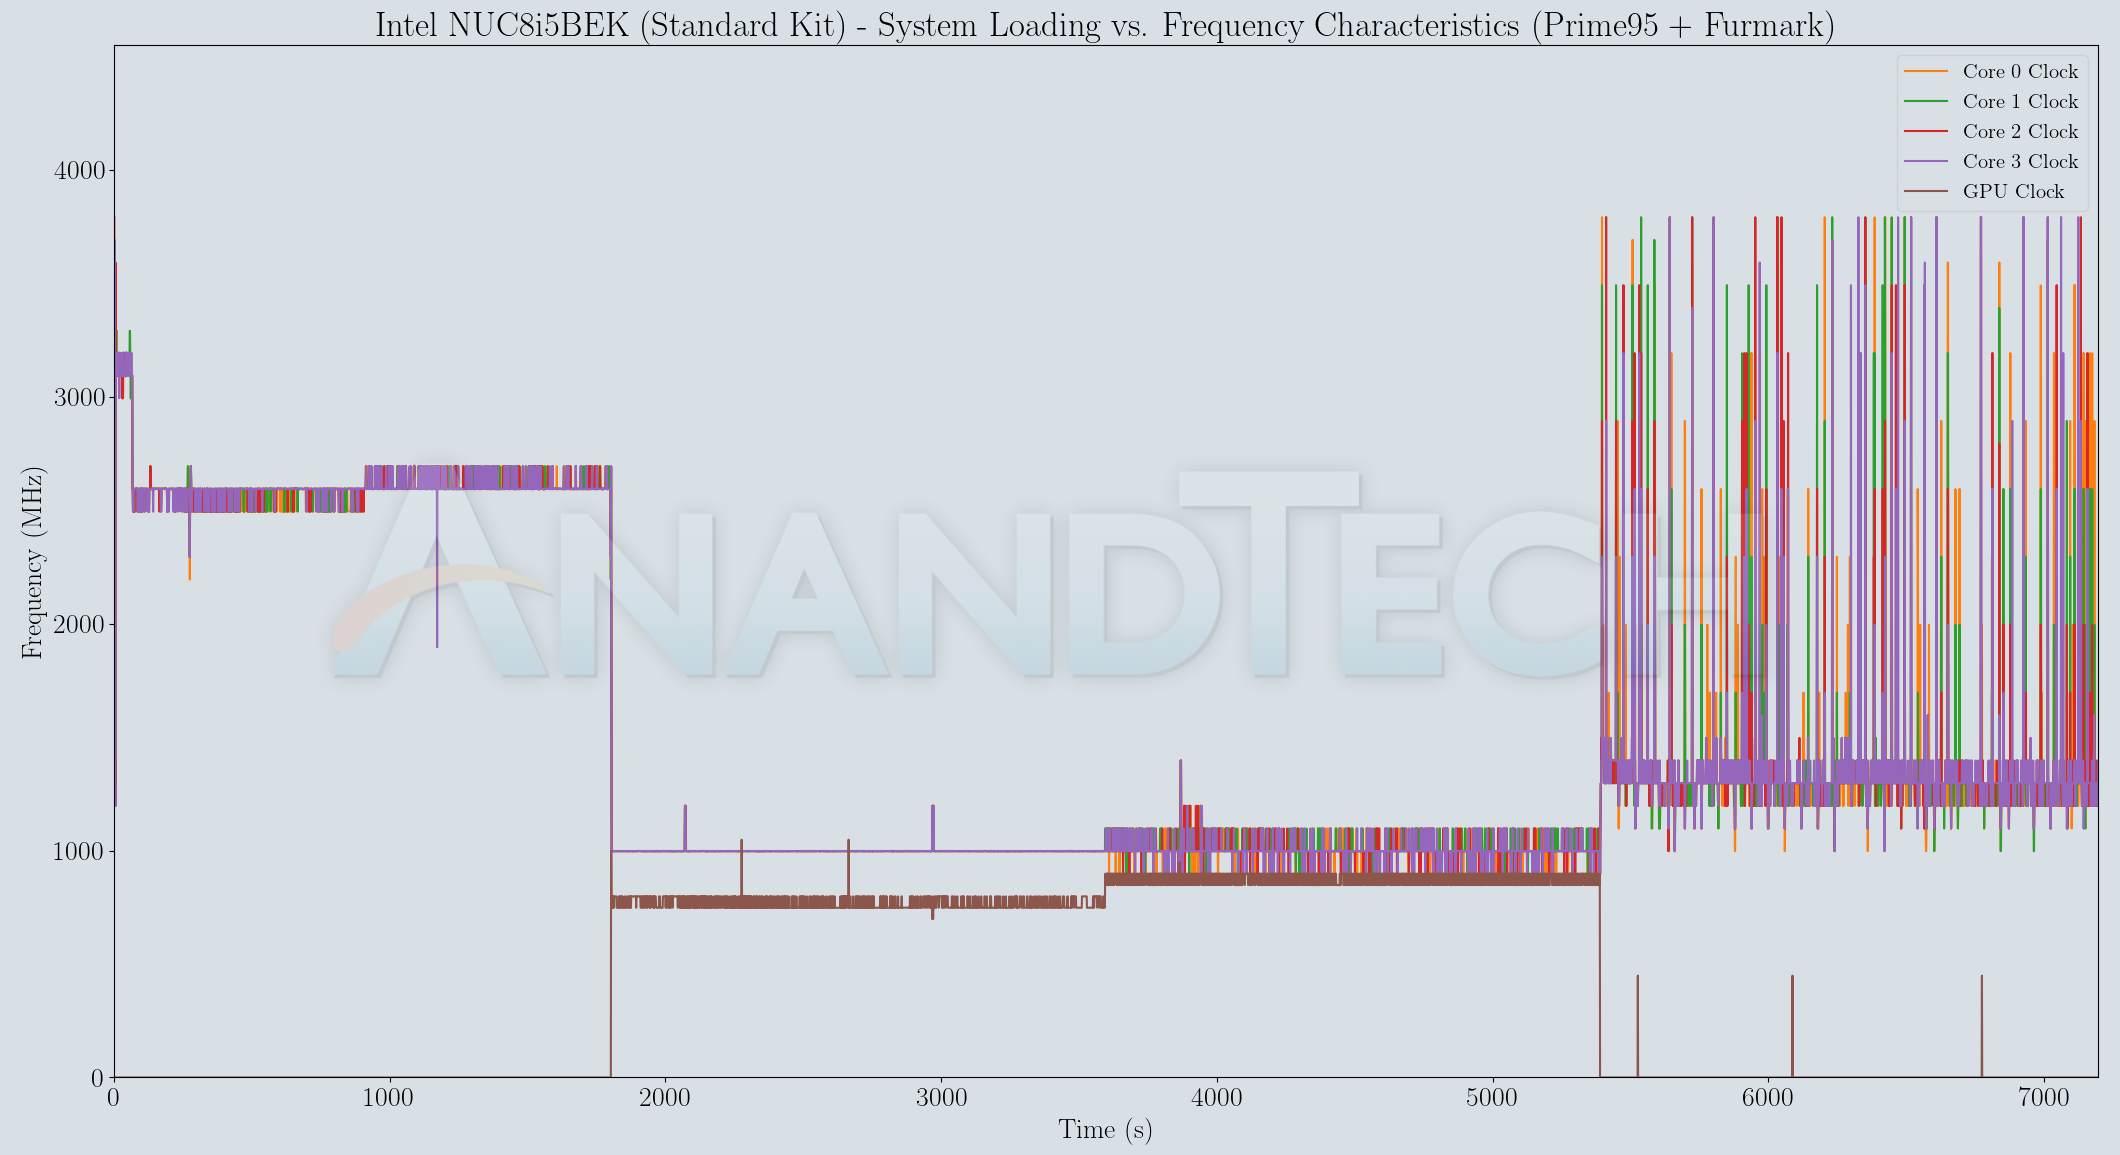
| Intel NUC8i5BEK (Standard Kit) System Loading with Prime95 and Furmark | |||
| Intel NUC8i5BEB (Akasa Turing) System Loading with Prime95 and Furmark | |||
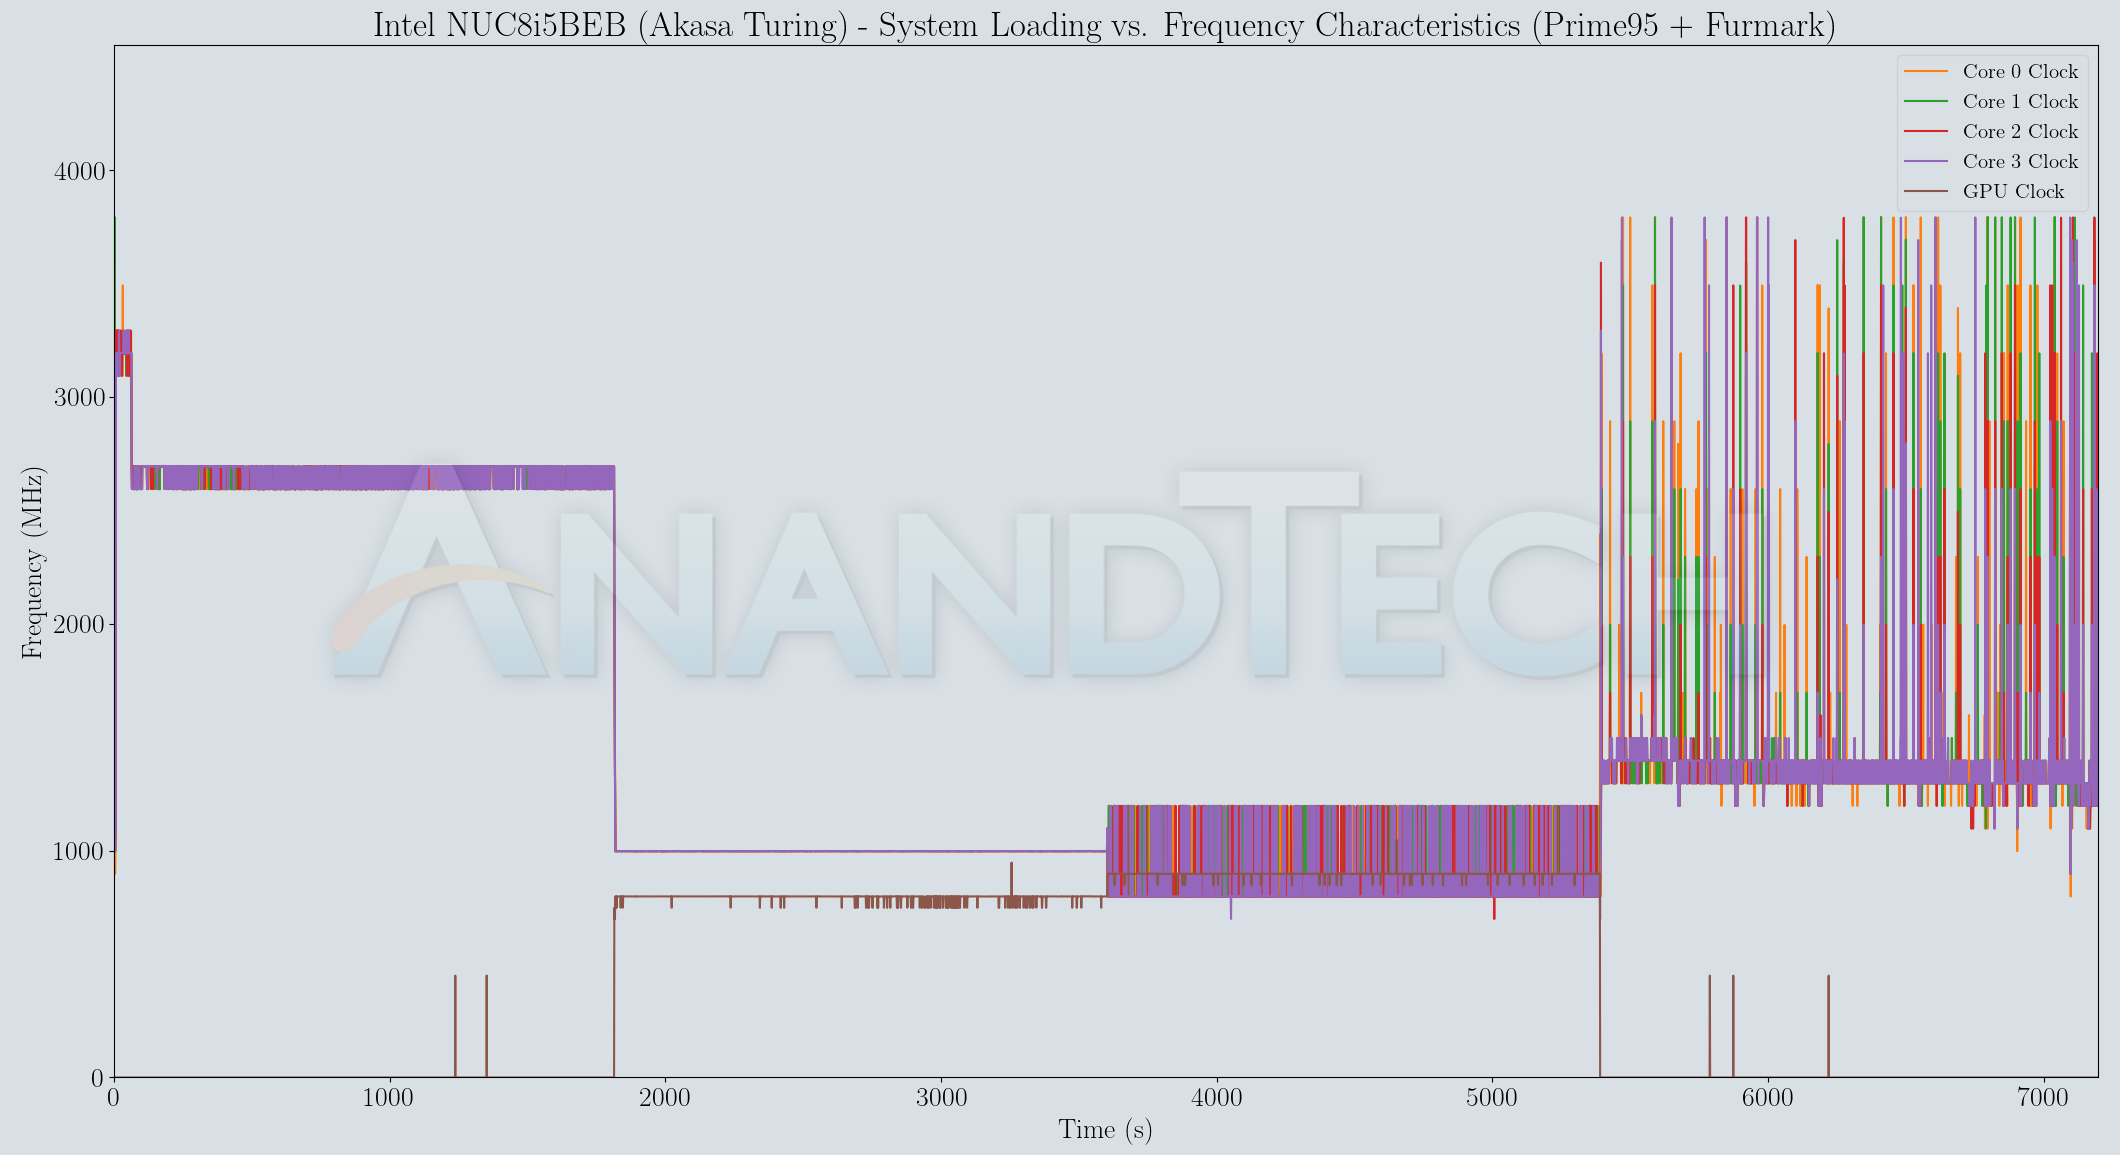
In the Prime95 case, the fanless version maintains steady frequency after the boost period, while the standard kit shows more variance around the same numbers. Once Furmark enters the picture, both the active and passive versions show similar frequency profiles for the components. The temperatures recorded during the process show the fanless version coming in at a full 10C below the actively cooled version. The larger heat sink / aluminum mass helps prevent thermal runaway of the sort happening in the standard kit (before the fan kicks in with full power to begin the cool-down). Power numbers again show slightly higher spikes in the boost zones for the standard kit.
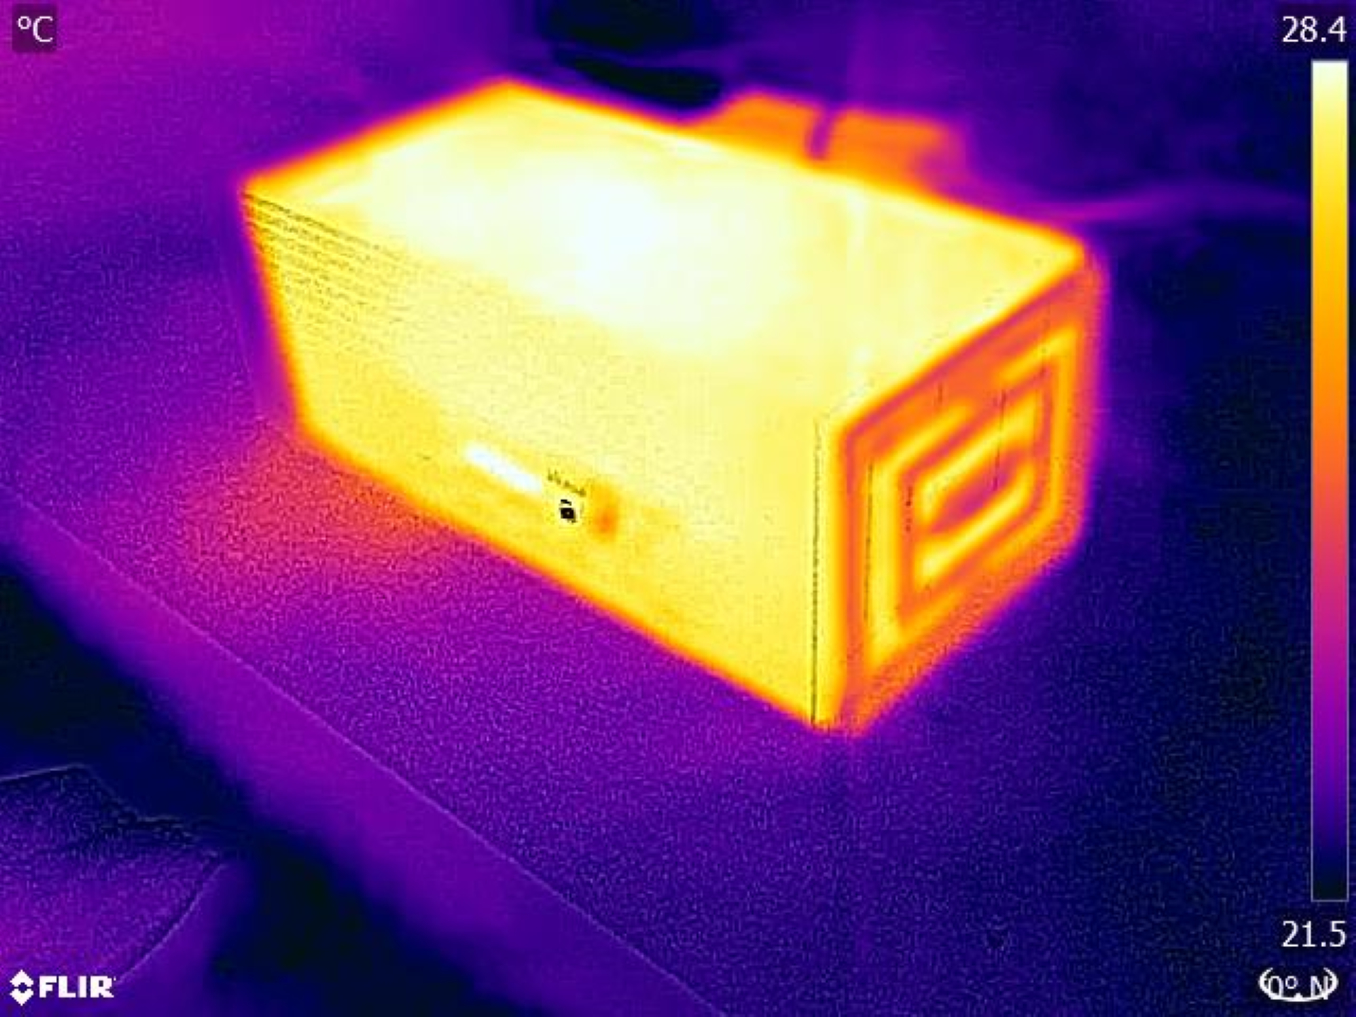
The above results confirm the efficacy of the Akasa Turing to keep the system running at its maximum rated package power consumption numbers without thermal runaway. However, the exterior temperature may also be of concern in situations where the system is kept within touching distance. We recorded some thermal photographs of the unit using a FLIR ONE Pro camera towards the end of each of the stress test components.

The maximum observed temperature was 66.8C deep towards the base of the heat sink fins and out of touch.
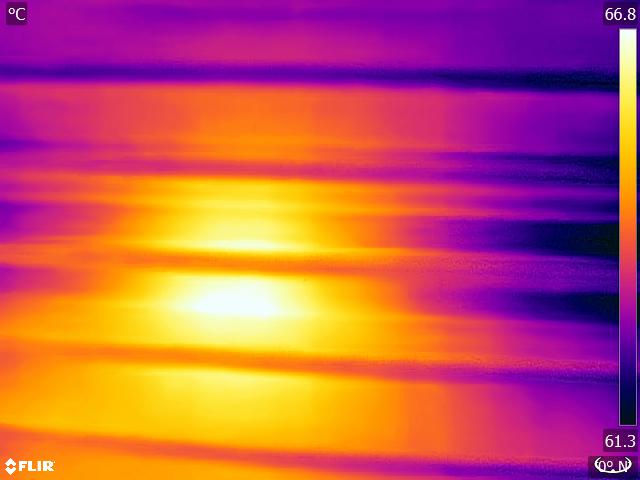


The gallery above presents more thermal photos, showing that the segments of the chassis within touching distance reach around 57C under these artificially-stressful testing conditions.
The Intel NUCs in general, and the Bean Canyon NUC8 series in particular, are proven solutions capable of efficiently serving multiple use-cases. Assembling the NUC is a trivial exercise, but building a passive system using the board is slightly more challenging. However, the satisfaction of seeing the NUC up and running without making even the slightest noise has to be experienced to be appreciated. Akasa's description of the build process in their installation manual (PDF) is very detailed, with the only drawback being the absence of a disassembly manual for the standard NUC kit. That aspect is one we have resolved in the section on the build process earlier in this piece. The removable front and rear I/O panels were also pointed out - these help Akasa achieve faster turnaround times for the newer NUCs. The Turing FX, for example, was release soon after the launch of the Frost Canyon NUC.
The empty chassis tips the scales at around 2.7 kgs. At 95mm x 113.5mm x 247.9mm, the physical footprint of the base (if oriented vertically) is actually smaller than that of the standard NUC kit with 2.5" drive support (117mm x 112mm x 51mm). The height is obviously around five times more to create a finned heat-sink with enough surface area to support the internal processor package's sustained 30W power consumption. In the thermal performance section, it was determined that the Akasa Turing is able to achieve this without much hassle.
The Akasa Turing is not without a few shortcomings - for example, there is no access to the microSDXC slot after the build is completed. This is in part due to the I/O placement distribution decided by Intel. In any case, attempting to insert and remove microSDXC cards from a slot in a warm or hot chassis is not advisable. Another issue is related to the absence of Wi-Fi antennae and relevant pigtails. Folks may prefer to use only wired networking for the system. Though we did not attempt to re-enable WLAN functionality in the Turing build, the following combination of pigtails and antennae should help those interested in it. The only bad performance evaluation result for the Turing build was the high SSD temperatures in the AIDA64 system stability test for the workload involving a disk stressing component. A M.2 SSD heat-sink would have come in helpful here. Akasa would do well to bundle items to help users retain the WLAN component and keep the NVMe SSD temperatures reasonable. If the assembly is being done from a pre-built NUC kit (like what was covered in this review), the consumer will also need to have cleaning alcohol or some other agent in order to scrape off the thermal paste on the package from the previous assembly. On the industrial design side, the sharp edges all around mean that the unit needs careful handling to avoid accidental cuts and bruises. In this scenario, a similar chassis with rounded edges could be a good addition to Akasa's portfolio.
The build described above has been running 24x7 for the last 12+ months servicing mainly Kodi playback from a local NAS, UHD Blu-ray playback, Netflix and YouTube streaming, and occasionally heavy browsing use as a living room HTPC. The previously deployed standard kit (which was put to similar use for a couple of weeks) was prone to ramping up its fan noise during YouTube playback with moderately active tabs in the background. Windows updates getting installed in the background used to result in a similar scenario - sometimes even with the television switched off. After the migration to the Akasa Turing chassis, the noise factor in the living room HTPC setup was completely eliminated. Under these use-case conditions (admittedly, not very stressful), the Akasa Turing build's package temperature averaged around 32C, and the chassis temperature never exceeded 30C. This excellent thermal profile was realized despite the unit being installed in a cabinet shelf (with a perforated door opening) that afforded essentially no ventilation / airflow.
With its massive heat sink chassis and solid aluminum construction, the chassis is able to keep the processor cooler than the standard kit with the fan. There is a slight reduction in the power consumption for the same workload. The design is contemporary - subjectively speaking, the unit is pleasing to look at, and doesn't need to be tucked away out of sight in a living room setting. On the pricing front, the unit contributes to almost a quarter of the eventual cost of the build, coming in at $134. That may appear as a premium to folks used to budget builds where the cost of a case and heat sink / cooling solution are negligible in the grand scheme of things. As a component that is responsible for the main attractive aspect of the build, the pricing is justfied in our opinion. All things considered, the Akasa Turing family deservedly earns our recommendation for the DIY enthusiast looking to create silent versions of the Bean Canyon and Frost Canyon NUCs.
"case" - Google News
October 26, 2020 at 08:00PM
https://ift.tt/3orVoTQ
Akasa Turing Fanless Case Review: Unrivalled Noiseless NUC - AnandTech
"case" - Google News
https://ift.tt/37dicO5
Shoes Man Tutorial
Pos News Update
Meme Update
Korean Entertainment News
Japan News Update
Bagikan Berita Ini


0 Response to "Akasa Turing Fanless Case Review: Unrivalled Noiseless NUC - AnandTech"
Post a Comment